Neurodegenerative signature
Key concepts
Assessed comparisons:
- MBM-3: melanoma metastatic cells in the brain compared to non tumor-bearing brain controls.
- AD-CT: cortex brain region from Alzheimer’s disease patients compared to cortex brain region from controls.
- AD-HP: hippocampus brain region from Alzheimer’s disease patients compared to hippocampus brain region from controls.
- PD-SN: substantia nigra brain region from Parkinson’s disease patients compared to substantia nigra brain region from controls.
- PD-ST: striatum brain region from Parkinson’s disease patients compared to striatum brain region from controls.
- MS: brain samples from multiple sclerosis patients compared to brain samples from controls.
Evaluation of the transcription pattern change in significant genes of each comparison:
Upregulated genes (UP, logFC > 0): genes more expressed in the first condition of the comparison (i.e. melanoma metastatic cells in the brain for MBM-3, or case samples for the neurodegenerative meta-analyses).
Downregulated genes (DOWN, logFC > 0): genes more expressed in the second condition of the comparison (i.e. non tumor-bearing brain controls for MBM-3, or control samples for the neurodegenerative meta-analyses).
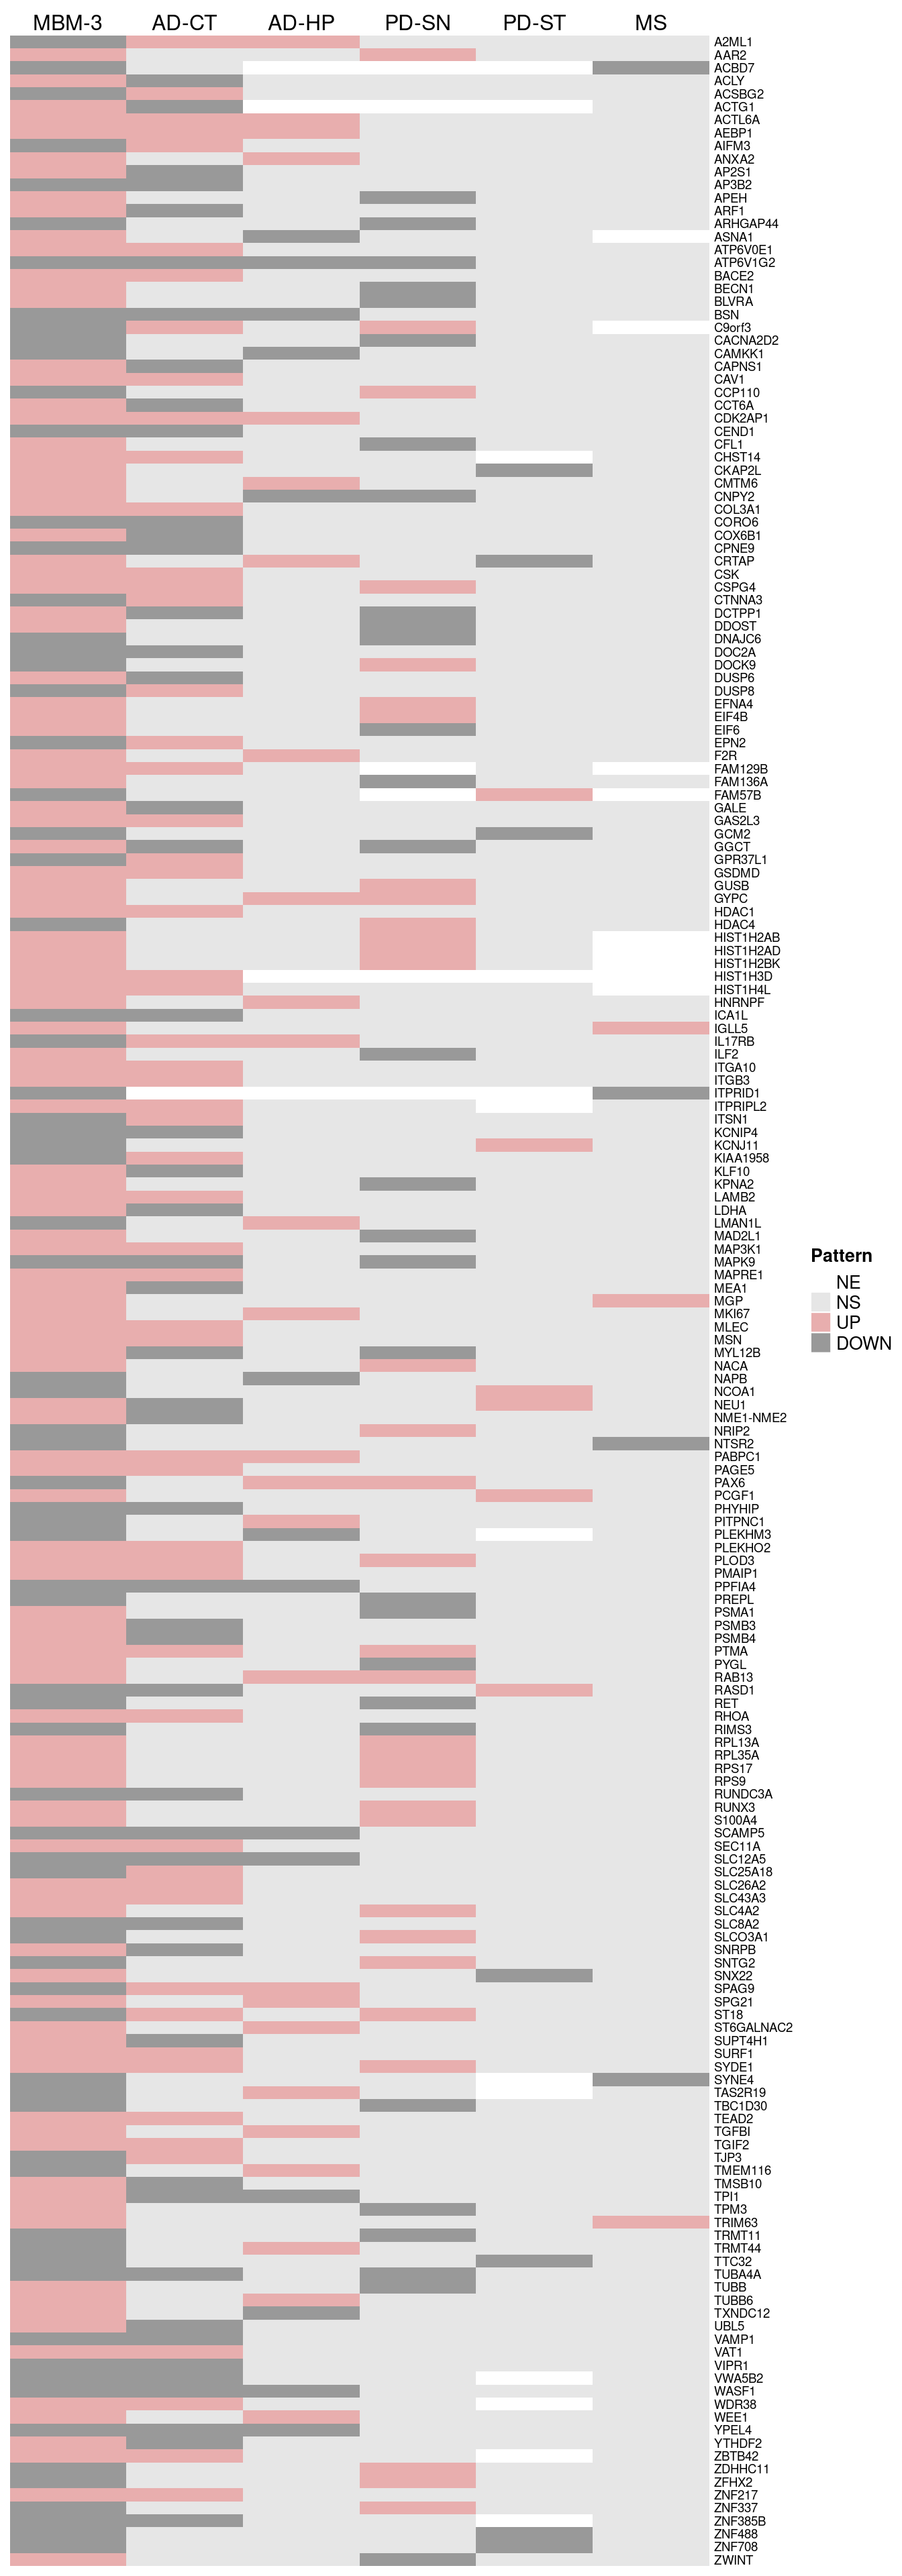
Neurodegenerative and tumoral signature of melanoma brain metastasis
Gene dysregulation profile by study/meta-analysis of the neurodegenerative signature:
Gene tumoral profile of melanoma brain metastasis
Gene dysregulation profile by study/meta-analysis of the melanoma brain-specific metastasis genes (MBM-3).