GSE37263
Exploratory analysis
Select the exploratory analysis of interest by clicking on the tab.
CT: cortex
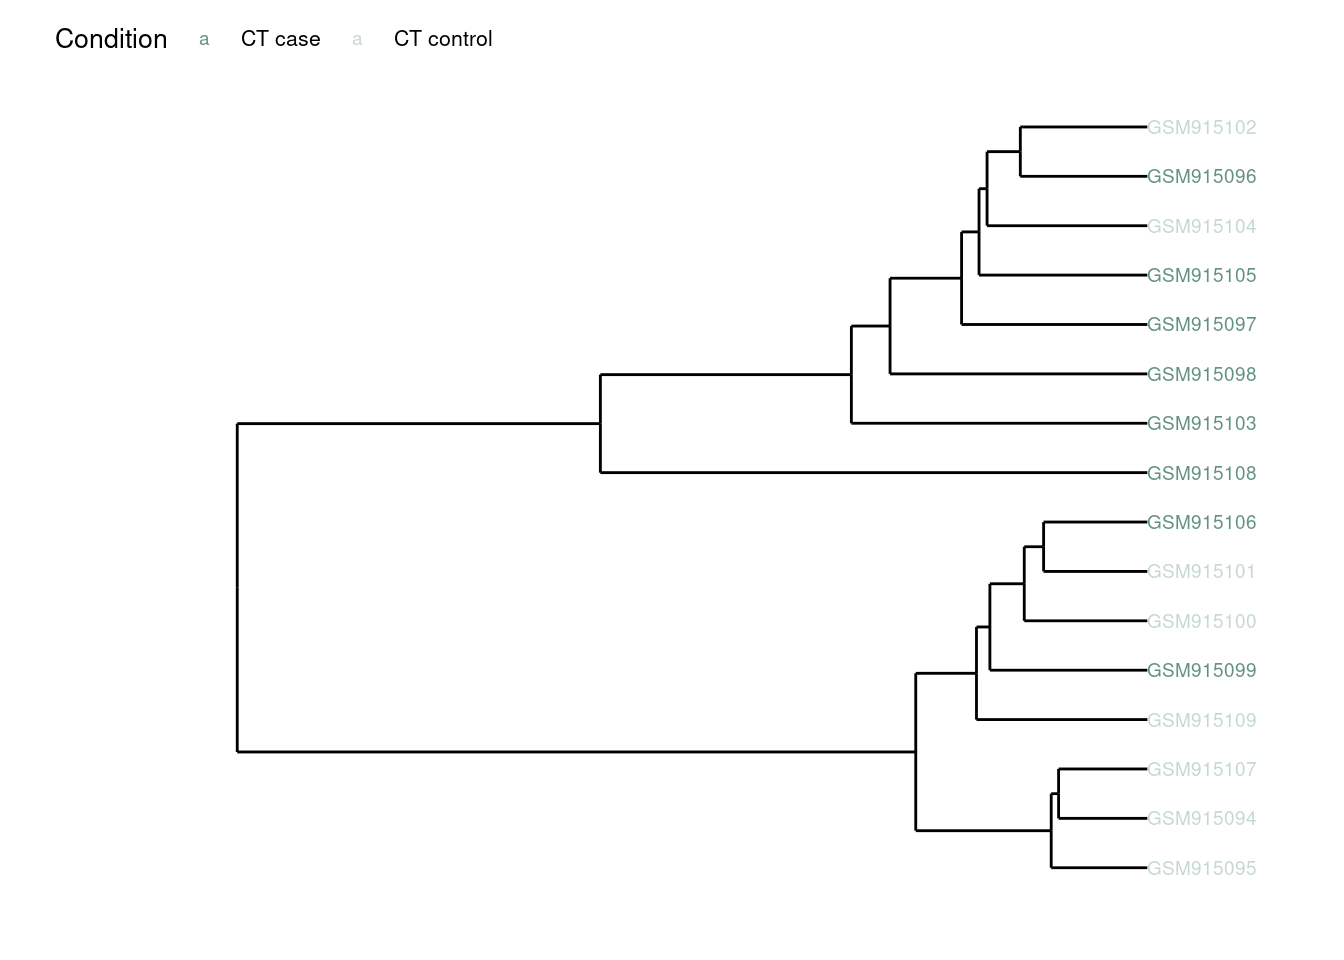
Differential gene expression analysis
Comparison of cortex brain samples: Alzheimer’s disease vs controls.
Summary
| Study ID | Total genes evaluated | Significative genes | Significative genes upregulated | Significative genes downregulated |
|---|---|---|---|---|
| GSE37263 | 17324 | 0 | 0 | 0 |
Of note, upregulated genes are those with a positive logFC value (logFC > 0); meaning that they are more expressed in the Alzheimer’s disease condition. Downregulated genes are those with negative logFC value (logFC < 0); meaning that they are more expressed in the control condition.
Results at gene level