Transcription Factor Activity
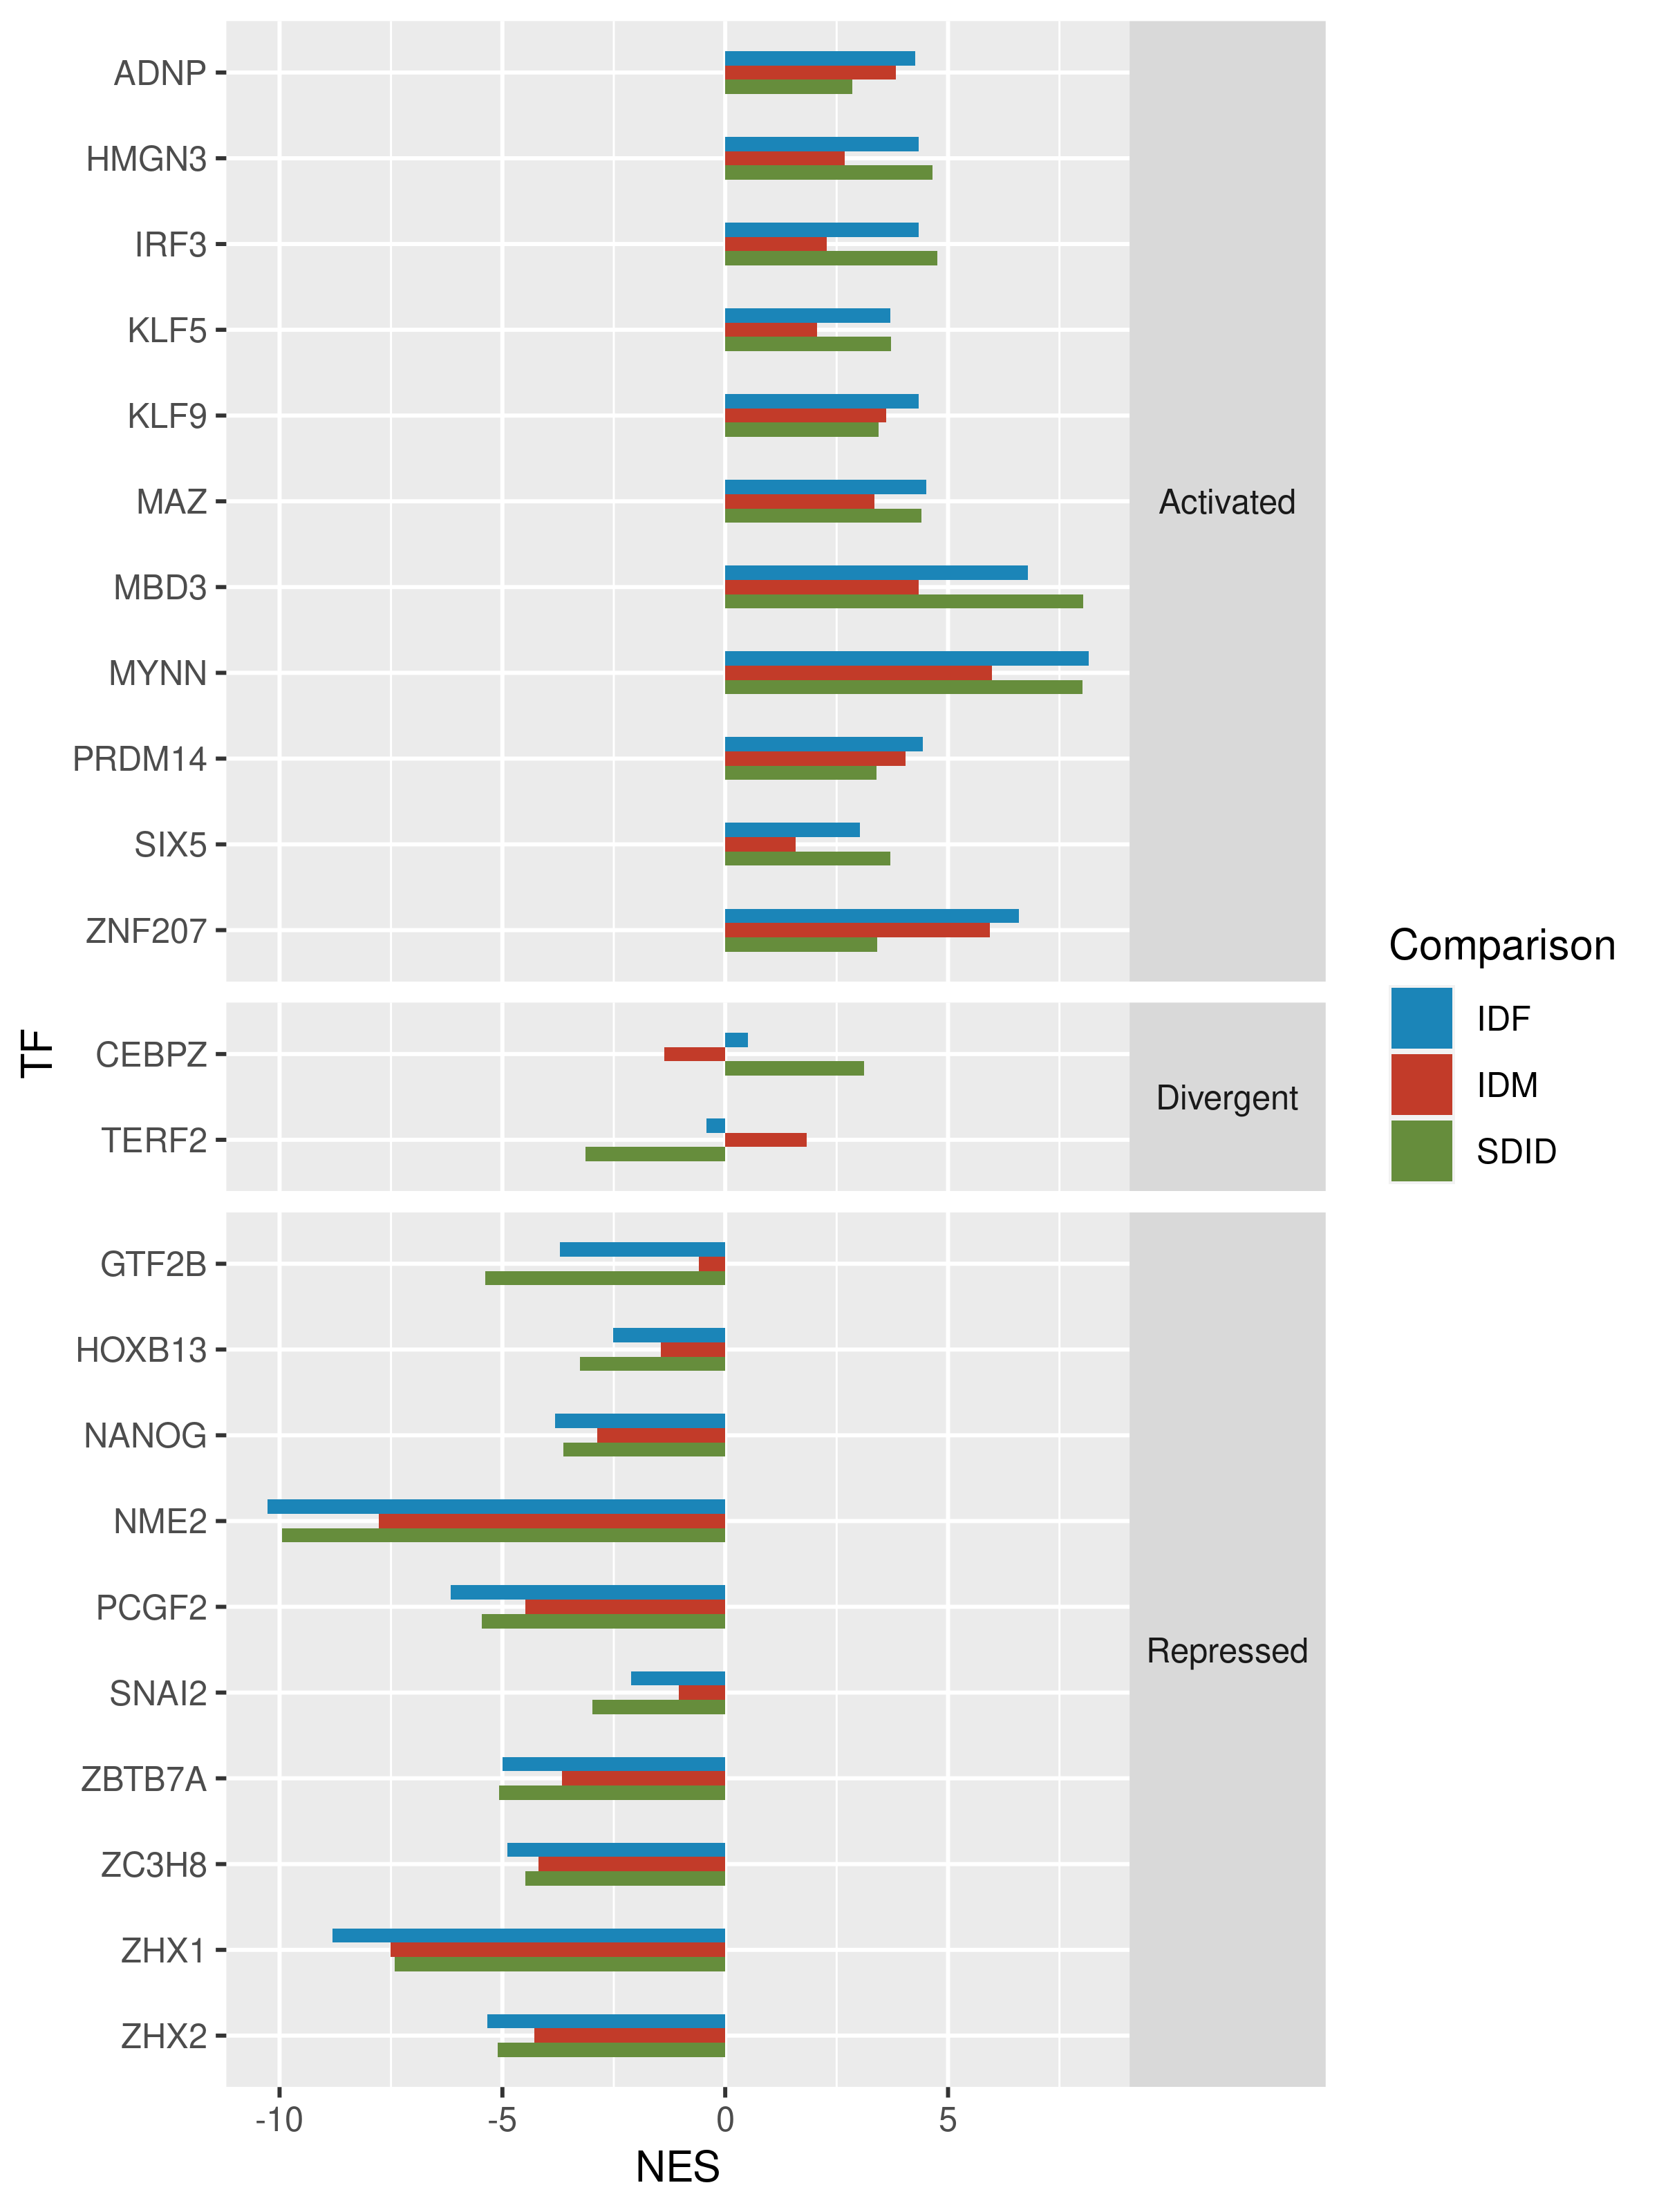
The analysis was conducted on the basis of meta-analysis results from the cerebral cortex region. Comparisons assessed:
IDF: impact of Alzheimer’s disease in females (case female - control female).
IDM: impact of Alzheimer’s disease in males (case male - control male).
SDID: sex-based differential impact on Alzheimer’s disease [(case female - control female) - (case male - control male)].
Transcription factors with significantly altered activity in SDID comparison

Results at transcription factor level
NES: normalized enrichment scores; Size: number of target genes.
Of note, upregulated genes are those with a positive logFC value (logFC > 0); meaning that they are more expressed in Alzheimer’s disease females. Downregulated genes are those with negative logFC value (logFC < 0); meaning that they are more expressed in control females.
NES: normalized enrichment scores; Size: number of target genes.
Of note, upregulated genes are those with a positive logFC value (logFC > 0); meaning that they are more expressed in Alzheimer’s disease males. Downregulated genes are those with negative logFC value (logFC < 0); meaning that they are more expressed in control males.
NES: normalized enrichment scores; Size: number of target genes.
Of note, upregulated genes are those with a positive logFC value (logFC > 0); meaning that they are more expressed in Alzheimer’s disease females compared to males. Downregulated genes are those with negative logFC value (logFC < 0); meaning that they are more expressed in Alzheimer’s disease males compared to females.