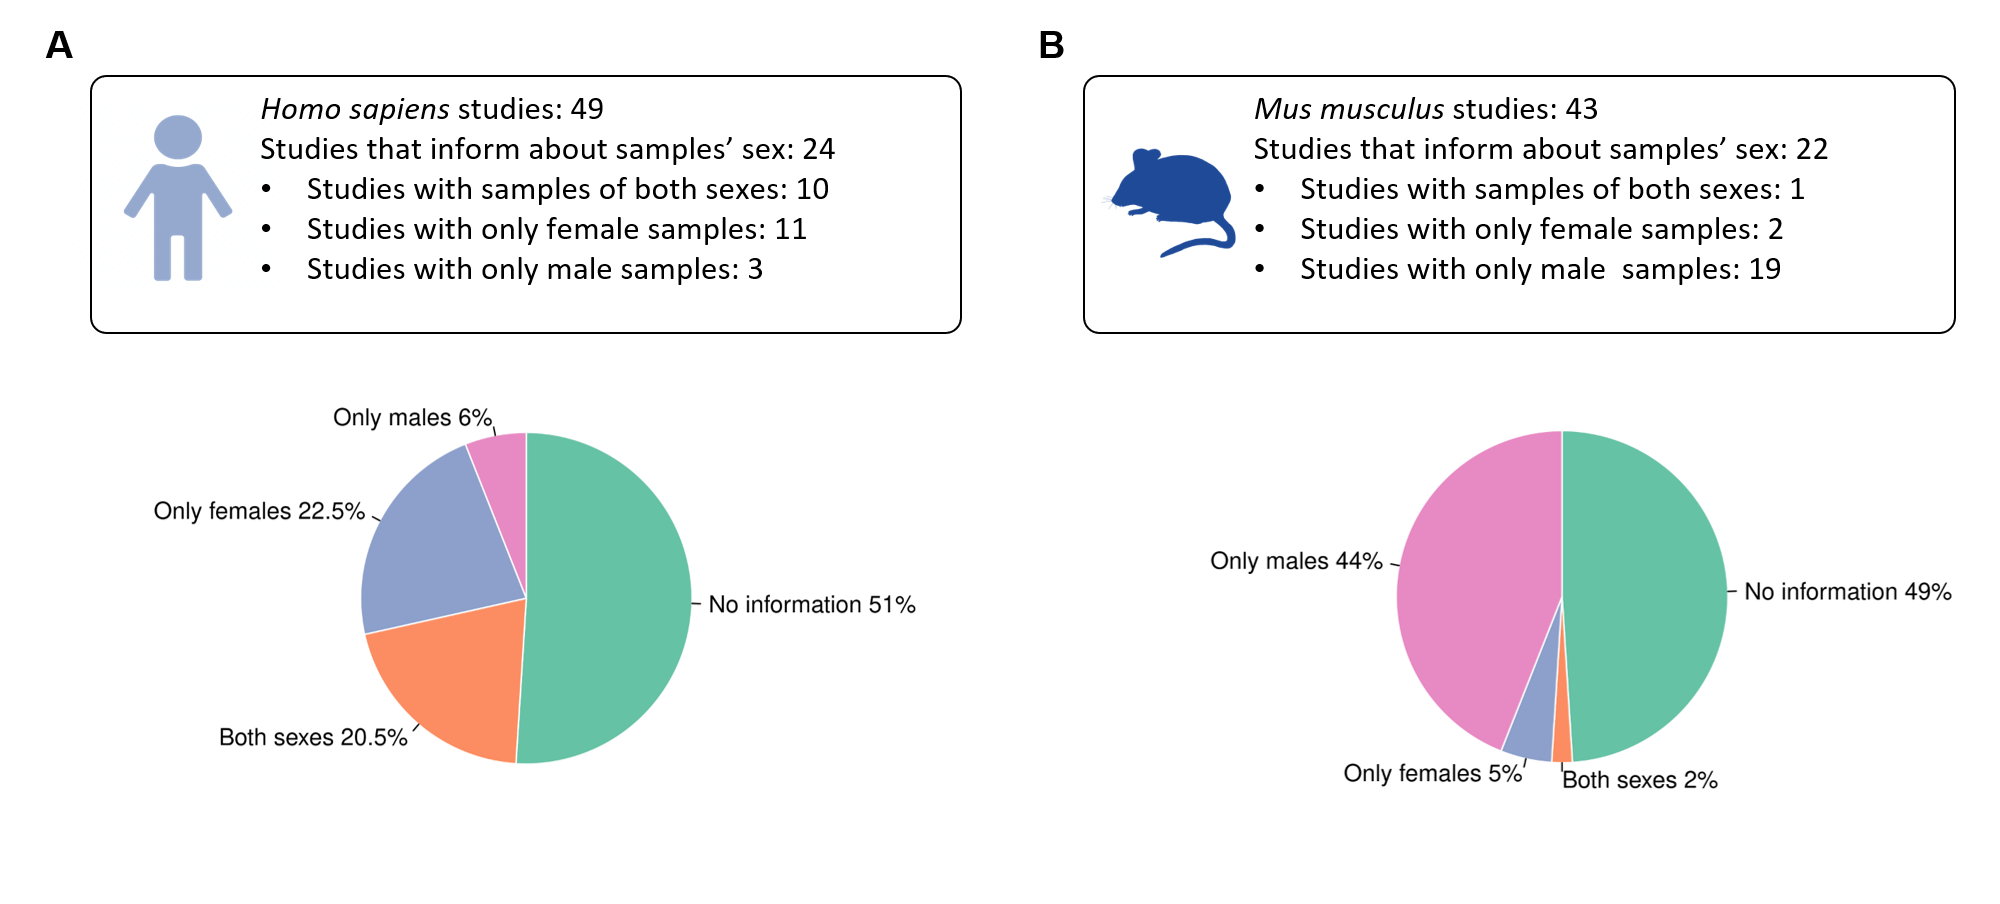
Summary of the sex variable inclusion found during the review of studies on each organism.
A) Out of 49 Hsa studies 24 studies(49%) properly specified the sex of the samples, 51%
of the studies lacked this information, only 20.5% of the studies used samples of both sexes
in the experimental procedure.
B) In Mmu, 51% of the studies presented information
about the sex, but focused mainly in male samples, almost no female samples were found in
these studies. Only one study included samples of both sexes.
| Platform | Description | N elegible studies | N selected studies | N Adipose samples | |||
|---|---|---|---|---|---|---|---|
| Any | Female | Male | |||||
| Homo sapiens | GPL570 | Affymetrix Human Genome U133 Plus 2.0 Array | 37 | 20 | 1058 | 445 | 132 |
| GPL6244 | Affymetrix Human Gene 1.0 Arraytranscript (gene) version | 15 | 13 | 343 | 144 | 26 | |
| GPL10558 | Illumina HumanHT-12 V4.0expression BeadChip | 14 | 7 | 498 | 88 | 144 | |
| GPL6947 | Illumina HumanHT-12 V3.0expression BeadChip | 12 | 9 | 825 | 198 | 379 | |
| TOTAL | 78 | 49 | 2774 | 875 | 681 | ||
| Platform | Description | N elegible studies | N selected studies | N Adipose samples | |||
|---|---|---|---|---|---|---|---|
| Any | Female | Male | |||||
| Mus musculus | GPL1261 | Affymetrix Mouse Genome430 2.0 Array | 34 | 16 | 280 | 24 | 165 |
| GPL6246 | Affymetrix Mouse Gene 1.0 ST Array transcript (gene) version | 24 | 6 | 133 | 10 | 51 | |
| GPL6887 | Illumina MouseWG-6 v2.0 expression BeadChip | 20 | 8 | 183 | 0 | 64 | |
| GPL6885 | Illumina MouseRef-8 v2.0 expression BeadChip | 15 | 8 | 375 | 0 | 243 | |
| GPL16570 | Affymetrix Mouse Gene 2.0 ST Array transcript (gene) version | 10 | 5 | 101 | 0 | 36 | |
| TOTAL | 103 | 43 | 1072 | 34 | 559 | ||
| Proposed gene | Relative stability in males | Relative stability in females | Expression level (TPM) | TPM in females | TPM in males |
|---|---|---|---|---|---|
| PPIA | 873 | 1589 | 234.597 | 236.1 | 233.6 |
| RPL19 | 1129.67 | 137.33 | 1707.61 | 1707 | 1708 |
| RPS8 | 194.67 | 178.33 | 952.191 | 944.5 | 957.9 |
| RPS18 | 119.33 | 296.33 | 3173.82 | 3180 | 3168 |
| UBB | 228 | 79 | 252.293 | 249.8 | 254.1 |
| UBC | 267.33 | 706.33 | 432.547 | 396.9 | 447.7 |
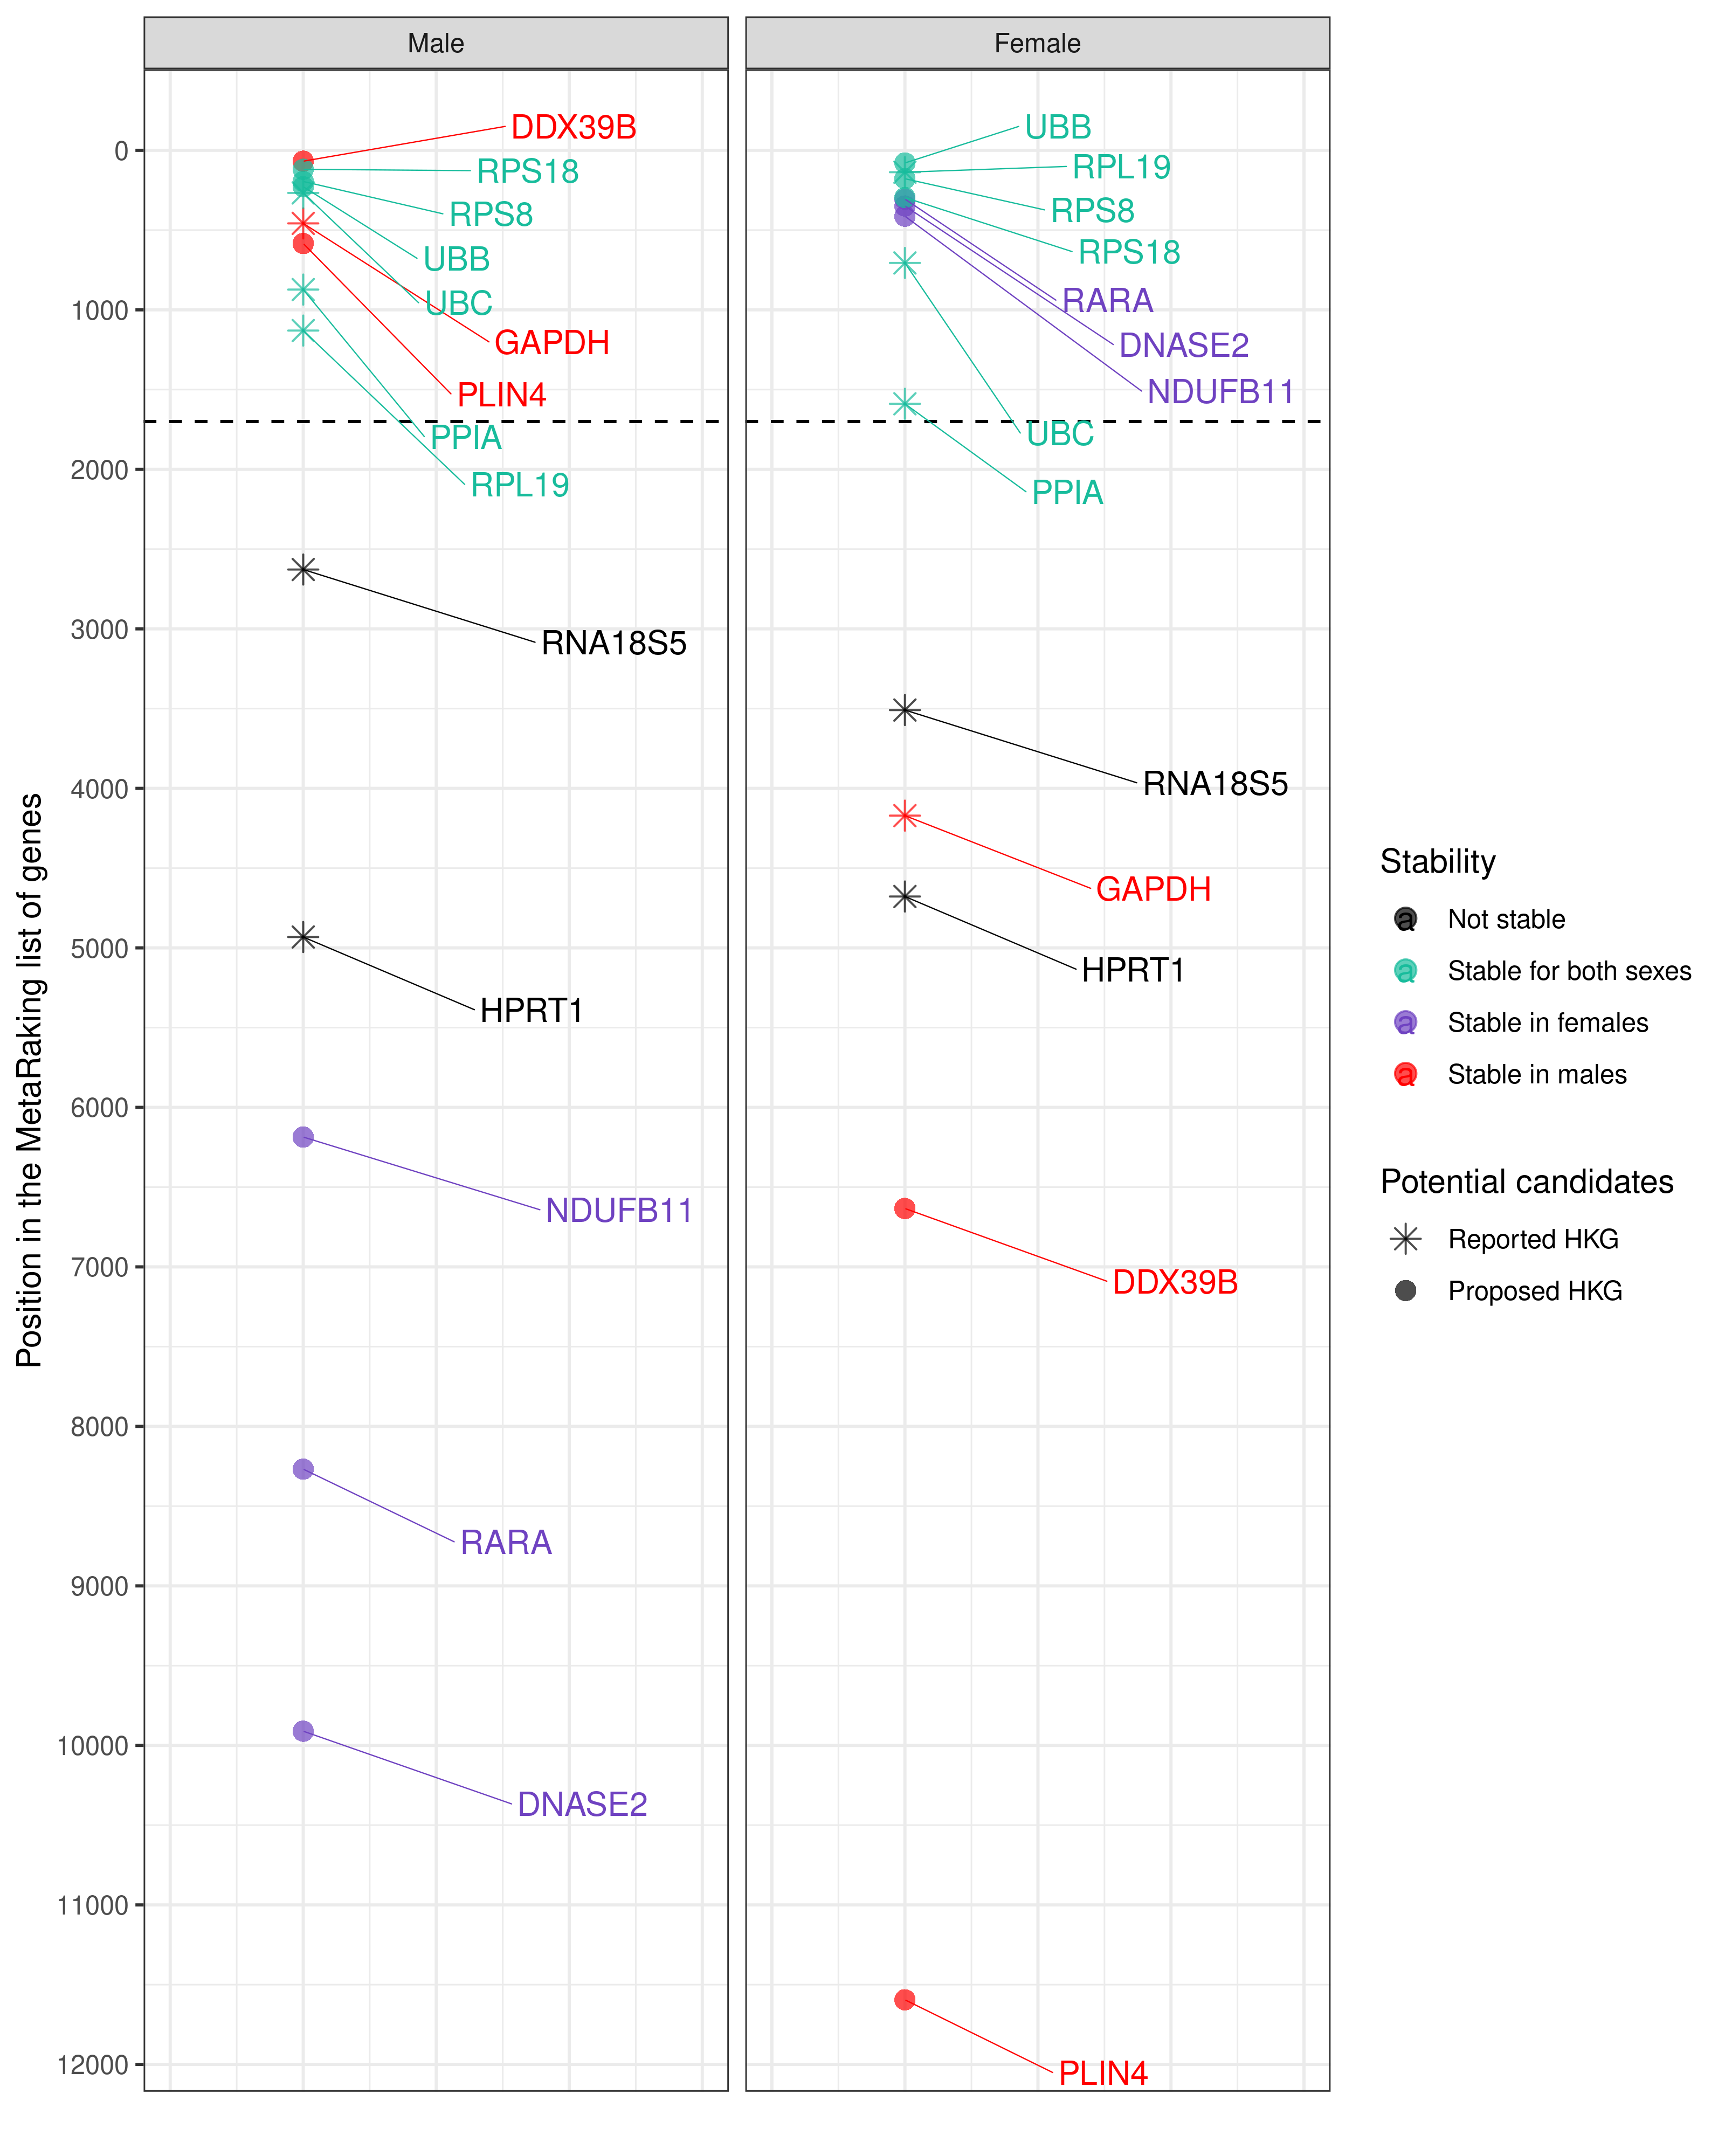
Selection of housekeeping candidate genes proposed to be used as a reference to compare both sexes in gene expression analysis. PPIA and RPL19 have been experimentally validated, RPS8, RPS18, UBB and UBC are computationally suggested. These genes are proposed based on their sex-specific values of relative expression stability, obtained from the final MetaRanking positions, and the expression levels have been extracted from GTEx, given in TPM (Transcripts Per Million) , which are high enough to be detected by different technologies.
| Proposed gene | Relative stability in males | Relative stability in females | Expression level (TPM) | TPM in females | TPM in males |
|---|---|---|---|---|---|
| ANXA2 | 396.67 | 8968 | 283.997 | 271.1 | 291.1 |
| DDX39B | 68 | 6633.67 | 197.455 | 192.5 | 201.9 |
| PLIN4 | 584.33 | 11594.67 | 499.806 | 441.3 | 530.7 |
| DNASE2 | 9911.33 | 349.33 | 38.042 | 37.54 | 38.25 |
| NDUFB11 | 6168 | 412.67 | 144.795 | 146.7 | 143.9 |
| RARA | 8267.67 | 306 | 42.575 | 41.94 | 43.71 |
Selection of housekeeping candidate genes proposed to be used as sex-specific reference in gene expression analysis. These genes are proposed based on their sex-specific values of relative expression stability, obtained from the final MetaRanking positions, and the expression levels have been extracted from GTEx, given in TPM (Transcripts Per Million), which are high enough to be detected by different technologies.