Network Viewer Box
Visualisation of biological subnetworks is one of the most important tasks for understanding biological systems. However, it is pretty difficult to manually draw the biological subnetworks containing a large amount of entities and various types of components. Thus, automatic drawing of biological subnetworks is considered as the essential approach for systems biology.
Through Network Viewer Box, users may explore the network generated in a user friendly window that allows to manipulated the network and obtain functional information interactively. The viewer has several options to facilitate the exploration of the MCN in a easy way. Network Viewer is associated with external Databases such as GO, Kegg, Reactome, Interpro, Jaspar and Ensembl.
The visualization tool was implemented using HTML, JavaScript and SVG, so Network Viewer works only in modern web browsers such as Google Chrome 14+, Microsoft Internet Explorer 9, Mozilla Firefox 6+ or Apple Safari 5+. No plugin is required.
If Network Viewer Box doesn't appear, please refresh the webpage.
Functionality
Network Miner viewer comprises three parts: (1) a basic dialog Menu and (2) a Toolbar at the top of its window. Below the toolbar is (3) the Subnetwork View Pane.
1. Menu
Edit
The Edit menu includes:
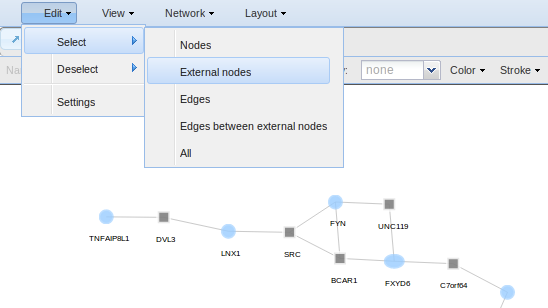
- Select for selecting all, nodes, external nodes, edges and edges between external nodes.
- Deselect for deselecting all, nodes or edges.
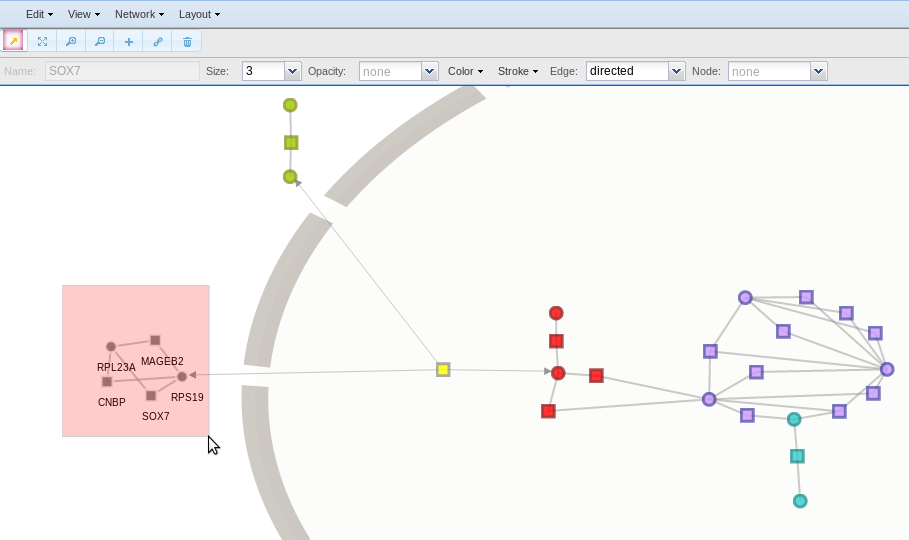
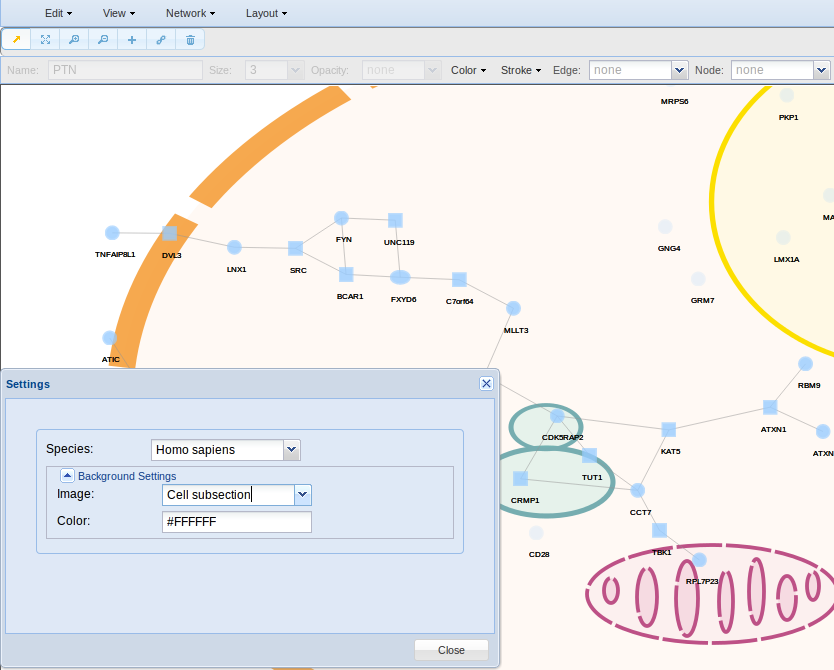
- Settings for changing the background. Here you can change the background colour or use an image. Several images are available, such as complete and partial animal/plant cell, with and without subcellular components.
View
The View menu contains the following options:
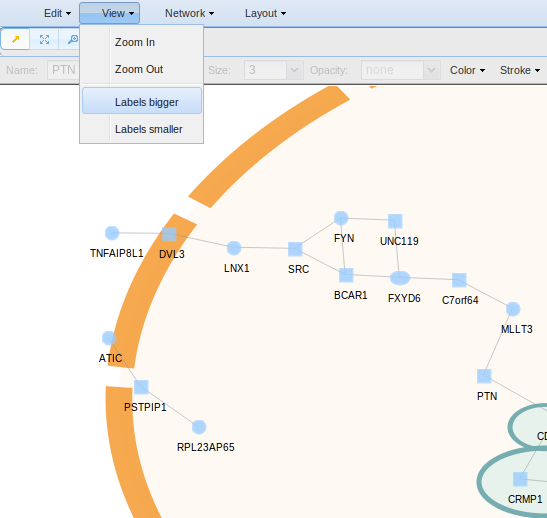
- Zoom In/Out for changing smoothly from a long shot to a close-up. The view is zoomed out, the network appears smaller, and when the view is zoomed in, the network appears larger.
- Labels Bigger/Smaller for changing labels size.
Network
The Network menu allows you the following actions:
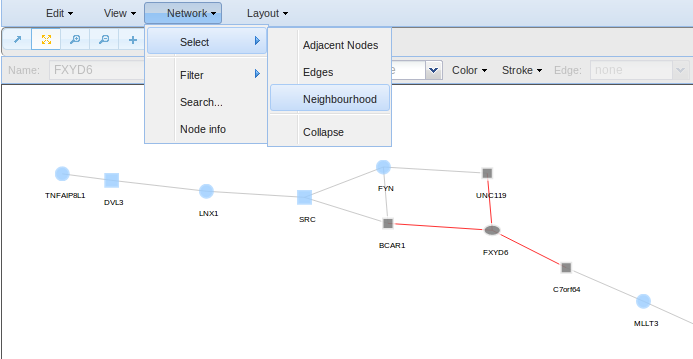
- Select for selecting nodes and edges adjacent to the already selected ones. Moreover, you can collapse a group of selected nodes to put them all together.
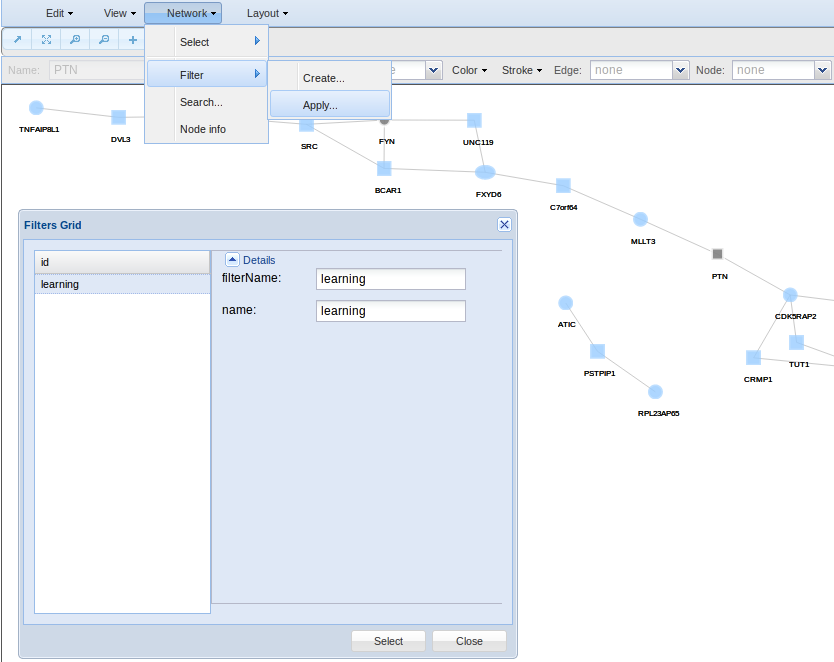
- Filter for creating and applying filters. As said before, Network Viewer is associated with external databases such as GO, Kegg, Reactome, Interpro, Jaspar and Ensembl. Here you can search and selected specific databases terms to create filters for automatic selection of nodes holding specific attributes.
- Search for looking for nodes by specific attributes such as the id, GO, Kegg, Reactome, Interpro, Jaspar and Ensembl terms.
- Get Node Information for obtaining node information like the genomic region (Chromosome Name, Gene Start (bp), Gene End (bp)), the functional annotation (GO, Kegg, Reactome), the protein domains (Interpro) and the regulatory elements (TFs).
Layout
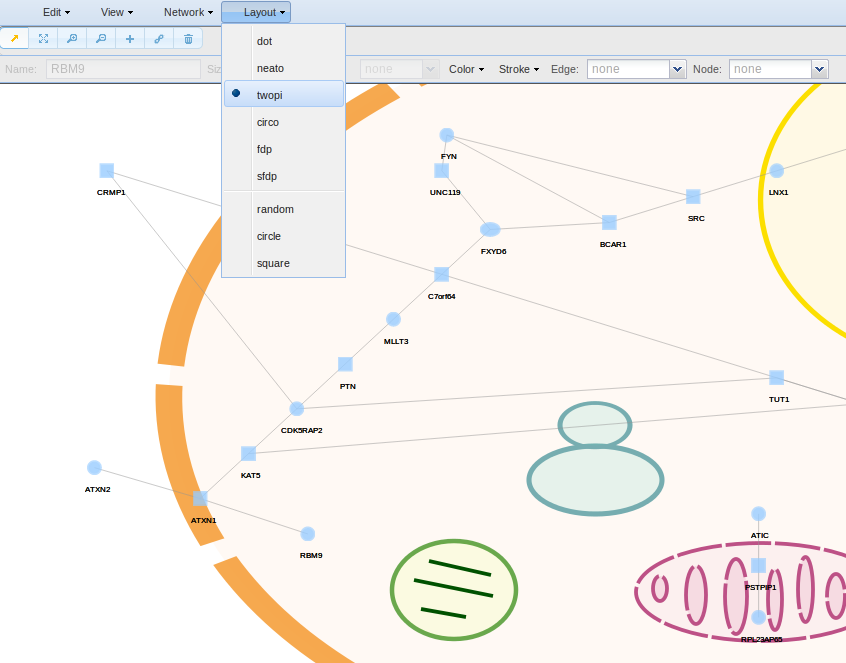
The Layout menu has a set of algorithms from Graphviz for changing the physical arrangement of the subnetwork. See http://www.graphviz.org/ for more information.
2. Toolbar
Toolbar includes options for adding/deleting, changing colour, shape, label and size of selected nodes and edges from the current subnetwork.

- To select a node, an edge using the mouse pointer or a group of nodes and edges by dragging your mouse pointer over a region of the network.
- To move the network around the viewer box.
- To zoom In
- To zoom Out
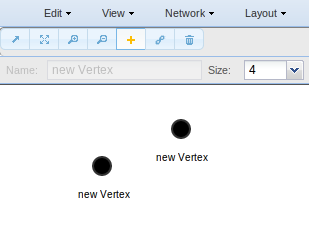
- To add a node
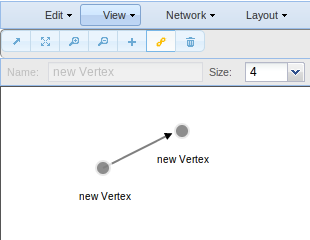
- To add an edge. Use the mouse pointer to select the node from/to the edge starts/finishes.
- To delete the nodes or edges selected.
- Name allows you to change the node name of the node selected.
- Size for changing the size of the nodes/edges selected.
- Opacity for opacity adjustment.
- Color for changing the color.
- Stroke for changing the stroke color.
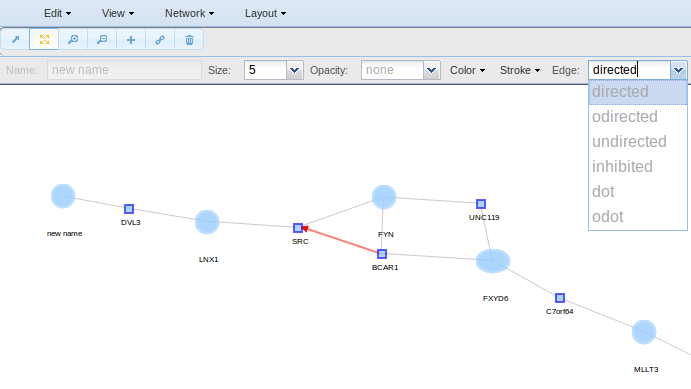
- Edge for selecting the edge shape.
- Node for selecting the node shape.
3. View Pane
The View Pane displays all the nodes and edges of the subnetwork. While the first button of the toolbar is active, the pointer moves edges and nodes (default). If the second button of the toolbar is active, therefore the pointer moves the whole graph.
Example
For example, if you want to select external nodes to change their colour, size, labels, etc, go to Edit > Select > External nodes. Once selected, you can go to the toolbar and changing the node colour, size, name, shape, etc.
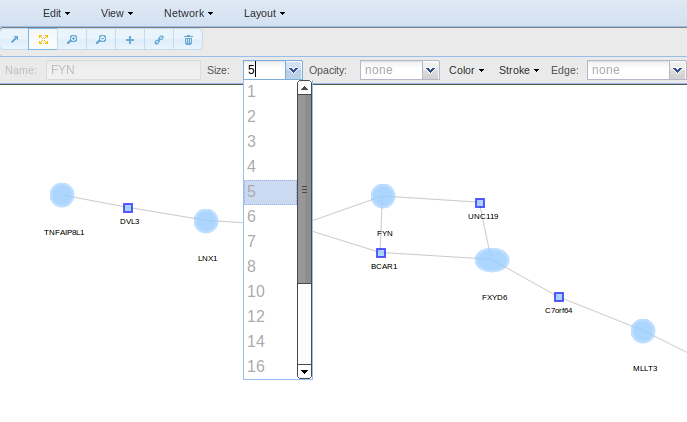
Alternatively, if you want to change the properties of any node, you can also use the pointer to select it.
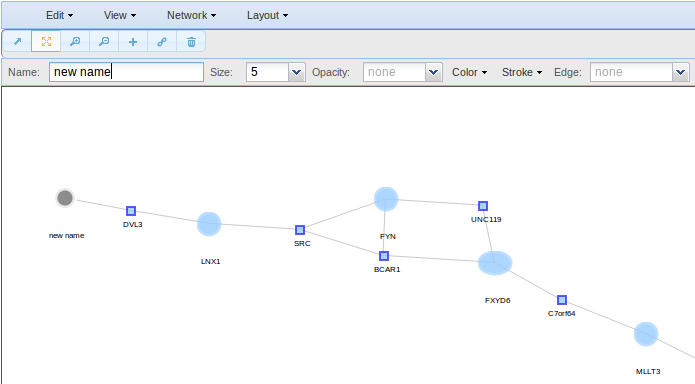
As for the nodes, to change the edges properties select the edges of interest though the pointer o though the Select option and go to the toolbar to change their colour, size, shape, etc.
Also you can add nodes and edges to your network.
In Edit > Settings you can change the background colour or use an image. Several images are available, such as complete and partial animal/plant cell, with and without subcellular components. In this example, a cell subsection was selected. To put an image as background may be of interest if you need to represent the subcellular location of you nodes.
In order to change smoothly from a long shot to a close-up the subnetwork or the labels size, go to View button in menu.
To change the physical arrangement of the nodes, go to Layout and select between a variety of algorithms provided by http://www.graphviz.org/
Go to Network > Select if you want to select adjacent nodes (Adjacent nodes), edges (Edges) or all (Neighbourhood) to the already selected ones to change their colour, size, labels, etc.
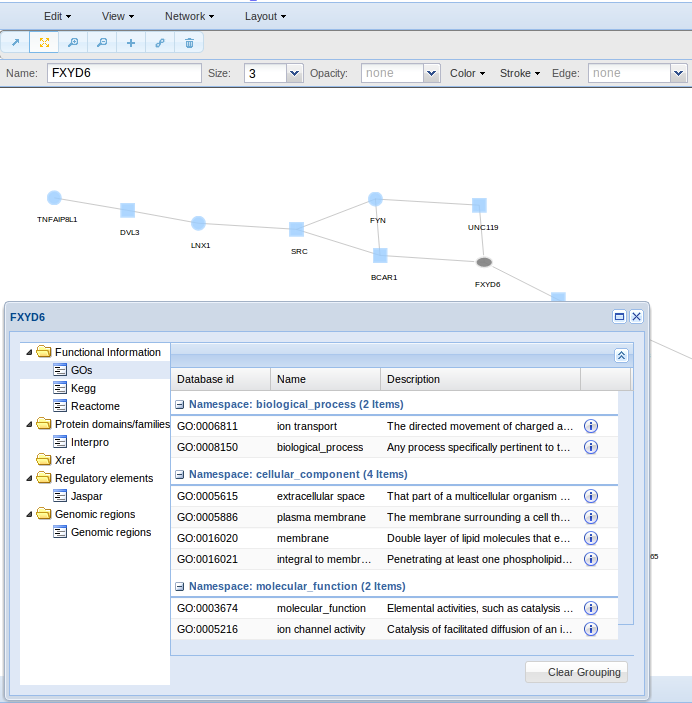
If you want to check all information relative to a node, use Network > Node Info. A box will show you information like the genomic region of the node (Chromosome Name, Gene Start (bp), Gene End (bp)), its functional annotation (GO, Kegg, Reactome), the protein domains (Interpro) and its regulatory elements (TFs).
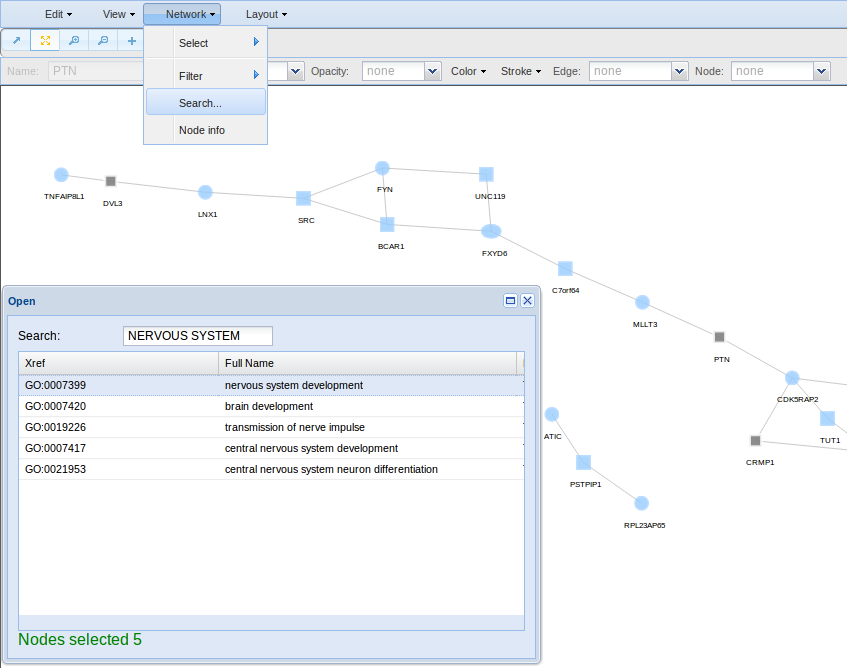
To screen your network by searching for any keyword, use Network > Search option. The keyword will be used to screen all term names and term descriptions in databases such as GO, Kegg, Reactome, Interpro, Jaspar and Ensembl.
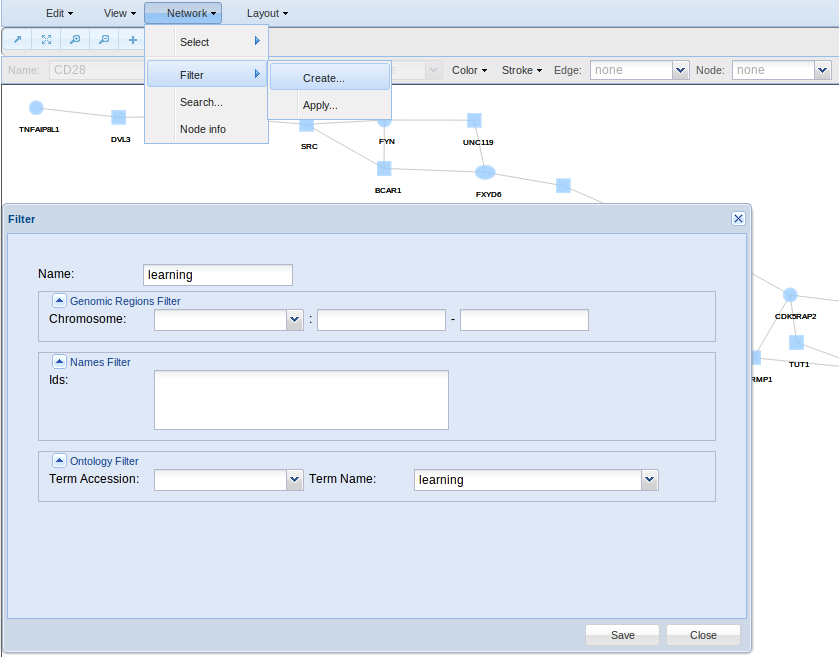
Finally, if you are interested in filter your nodes by any attribute such as a GO term, chromosome, etc, then you can create a filter in the Network > Filters > Create option. In the example, a filter based on the keyword learning is defined. Press save to be sure your filter will be stored up for future use.
In order to apply any of you filters, go to Network > Filters > Apply. Here you can show all your filters and use them.
