Methods
This web site summarizes the bioinformatics and statistical methods used. A more extended version of the complete methods can be found in the article.
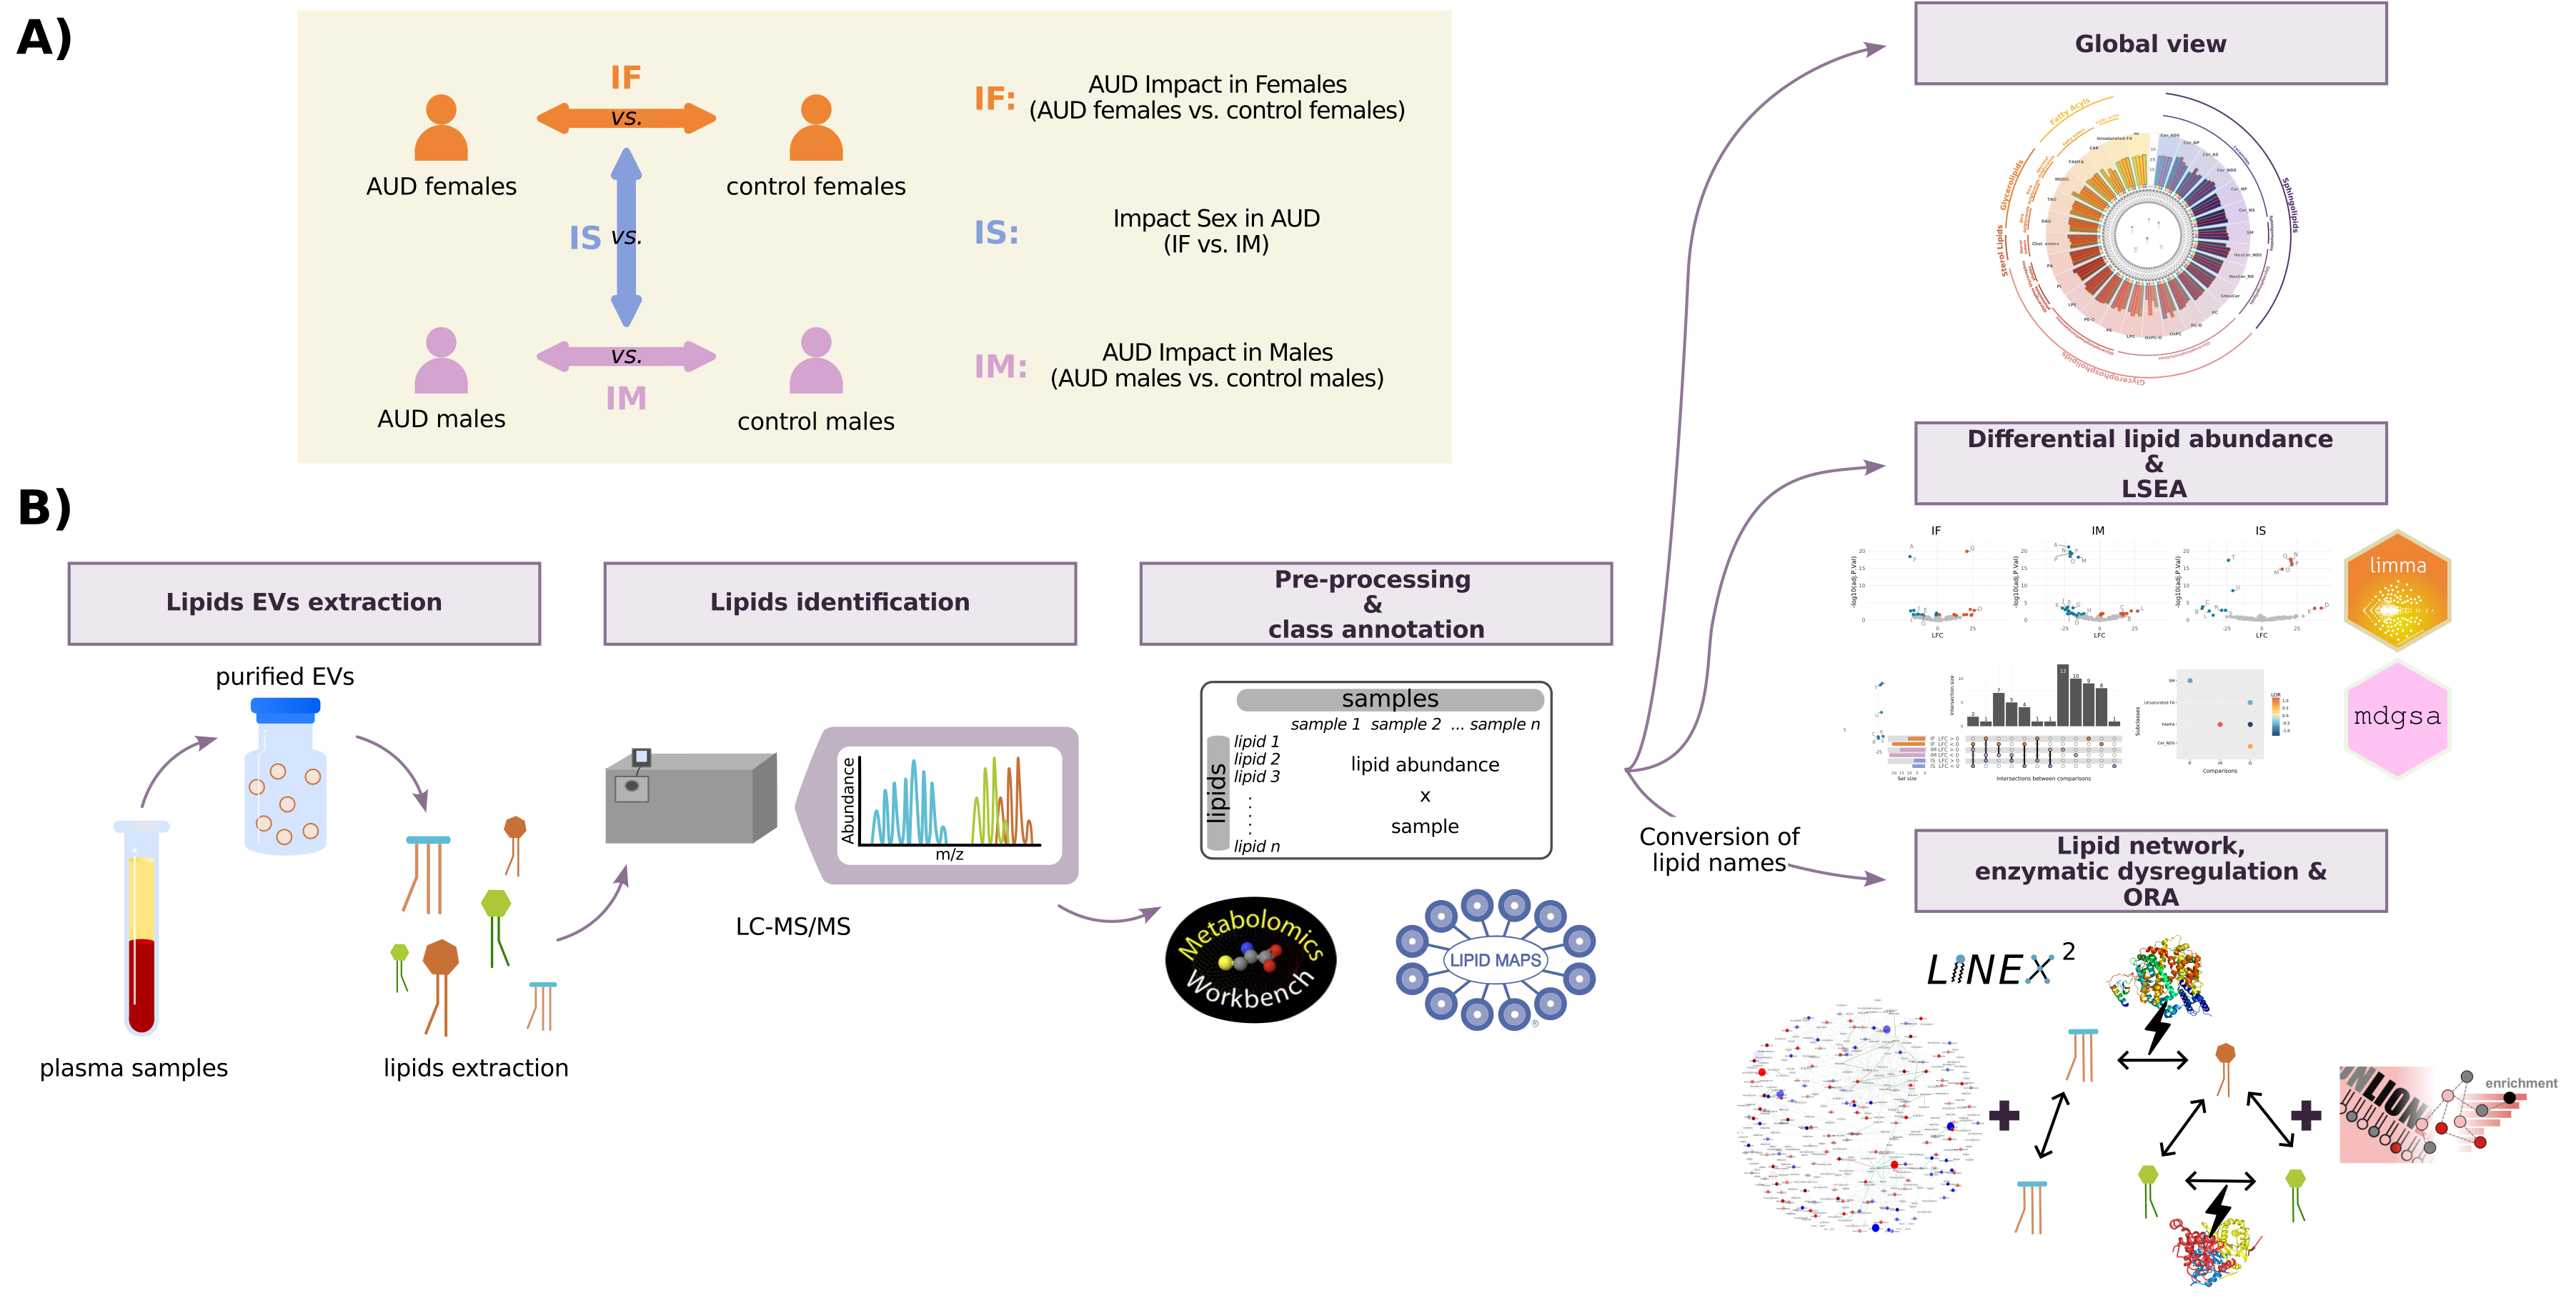
After LC-MS/MS analysis, annotation and identification of the lipids, the analyses described in Figure 1 and detailed below were performed. The software used was R v4.1.2. [1].
Bioinformatic Analyses
1. Data Preprocessing
Data preprocessing included filter entities, normalization of abundance lipid matrix, and exploratory analyses. Mass Hunter Qualitative results (.cef file) were imported into Mass Profiler Professional (MPP) (Agilent Technologies) for statistical analysis. Entities were filtered based on their frequency, selecting those consistently present in all replicates of at least 1 treatment. A percentile shift normalization algorithm (75%) was used, and datasets were baselined to the median of all samples. Data normalization was followed by exploratory analysis using cluster analysis, principal component analysis (PCA), and box and whisker plots by samples and lipids to detect abundance patterns between samples and lipids and batch effects anomalous behavior in the data. At this point, anomaly-behaving samples and outliers (values that lie over 1.5 x interquartile range (IQRs) below the first quartile (Q1) or above the third quartile (Q3) in the data set) were excluded for presenting a robust batch effect with a critical impact on differential abundance analysis.
2. Differential Lipid Abundance
Lipid abundance levels between groups were compared using the limma R package [2]. P-values were adjusted using the Benjamini & Hochberg (BH) procedure [3], and significant lipids were considered when the BH-adjusted p-value ≤ 0.05.
3. Class Enrichment Analysis
Class annotation was conducted using the RefMet database [4] and compared with the LIPID MAPS database [5]. Description of abbreviations is detailed in supplementary files. Annotation was followed by ordering lipids according to the p-value and sign of the statistic obtained in the differential lipid abundance. Similar to a Gene Set Enrichment Analysis (GSEA) method, a class enrichment analysis was carried out using Lipid Set Enrichment Analysis (LSEA) implemented in the mdgsa R package [6]. The p-values were corrected for BH, and classes with a BH-adjusted p-value ≤ 0.05 were considered significant.
4. Lipid Network
The Lipid Network Explorer platform (LINEX2) [7] was used for lipid metabolic network analysis to gain insights into the sex-specific dysregulation of lipid metabolism in AUD patients. For this purpose, single lipid species were considered, either as sum or molecular species, regardless of their retention time and ion mode acquisition. For that reason, prior to conducting the analysis, the lipid nomenclature was checked to ensure that the majority of the lipids in the study were included. This review was carried out using the MetaboAnalyst 5.0 platform and the LipidLynxX Converter tool. Additionally, a manual revision was performed on a lipid-by-lipid basis to ensure accuracy. LINEX 2 analysis brought forth several results. The global network of lipid species provides both qualitative and quantitative associations between species based on defined reaction types and Spearman’s correlation, respectively. In addition, changes in lipid levels between different experimental conditions can be derived from different statistical metrics. The subgraph with the largest average substrate-product changes was obtained through a lipid network enrichment algorithm, which took enzymatic multispecificity into account and generated hypotheses regarding enzymatic dysregulation. This algorithm consists of a local search approach which generally examines a search space in a greedy manner by iteratively testing local candidate solutions for the one with an optimal objective function. Candidate solutions are generated by applying one of three operations: node insertion, deletion, and substitution to the solution from the last iteration or a randomly selected subgraph in the first iteration. Lastly, LINEX2 provided a target lipids list derived from the lipids subgraph, which was utilized for an enrichment analysis using LION-web. This enabled a more in-depth examination of the functional significance and potential biological implications of the identified lipid alterations.
5. Comparisons
3 comparisons were performed to analyze differential lipid abundance:
- The AUD Impact in Females (IF), which compares females with AUD and control females.
- The AUD Impact in Males (IM), which compares males with AUD and control males.
- The Impact of Sex in AUD (IS), which compares IF and IM.
Class enrichment analysis was assessed using the same three comparisons. LINEX2 analysis related to the global network was conducted using IF and IM comparisons, and the subgraph with the largest average substrate- product changes was obtained using the control groups as a reference.
The statistics used to measure the differential patterns were the logarithm of fold change (LFC) to quantify the effect of differential lipid abundance, and the logarithm of odds ratio (LOR) to measure the enrichment of each functional class. A positive statistical sign indicates a higher mean for the variable in the first element of the comparison, whereas a negative statistical sign indicates a higher mean value for the second element. The IS comparisons focus on finding differences between female and male comparisons. Thus, a positive statistic may indicate either upregulation in females and downregulation in males or a higher increase or a lower decrease of the variable in human females with AUD. On the other hand, a negative statistic may indicate either upregulation in males and downregulation in females or a higher increase or a lower decrease of the variable in human males with AUD. In this comparison, the behavior of each lipid across the groups must be assessed a posteriori, examining female (IF) and male (IM) comparisons.
References
- R Core Team R: A Language and Environment for Statistical Computing; R Foundation for Statistical Computing: Vienna, Austria, 2019.
- Ritchie ME, Phipson B, Wu D, Hu Y, Law CW, Shi W, et al. limma powers differential expression analyses for RNA-sequencing and microarray studies. Nucleic Acids Res. 2015;43:e47.
- Benjamini Y, Hochberg Y. Controlling the False Discovery Rate: A Practical and Powerful Approach to Multiple Testing. J R Stat Soc Ser B Methodol. 1995;57: 289–300.
- Fahy E, Subramaniam S. RefMet: a reference nomenclature for metabolomics. Nat Methods. 2020;17: 1173–1174.
- Sud M, Fahy E, Cotter D, Brown A, Dennis EA, Glass CK, et al. LMSD: LIPID MAPS structure database. Nucleic Acids Res. 2007;35: D527–D532.
- Montaner D, Dopazo J. Multidimensional Gene Set Analysis of Genomic Data. Hoheisel J, editor. PLoS ONE. 2010;5: e10348.
- Rose TD, Köhler N, Falk L, et al. Lipid network and moiety analysis for revealing enzymatic dysregulation and mechanistic alterations from lipidomics data. Brief Bioinform. 2023;24: bbac572.