Methods
Bioinformatics and statistical analysis were run in R software v.3.6.2 [1]. Figure 1 summarizes the workflow followed in this study.
1. Systematic review
1.1 Literature review
The systematic review was performed by searching for the keyword
Parkinson disease on GEO and ArrayExpress transcriptomic databases [2, 3],
up to October 2020.
Results were filtered by:
- Organism: Homo sapiens
- Study type: Expression profiling by array or Expression profiling by high throughput sequencing
- Sample count: at least 12 samples
1.2 Study exclusion criteria
The following exclusion criteria were applied:
- Studies not based on MS
- Experimental design different to patients vs. controls
- Absence of information on the sex of the individuals
2. Data acquisition and preprocessing
The studies selected in the systematic review were downloaded and standardized. Gene names were converted to Gene Symbol nomenclature and the median was calculated in the case of multiple values for the same gene. The labels of the sex of the patients were homogenized and the individuals were grouped into healthy or affected by the disease. Paired samples were tagged to account for this factor in subsequent analyses. After data normalization, an exploratory analysis was performed, using clustering and principal component analysis (PCA), to detect possible batch effects and anomalous behavior in the data.
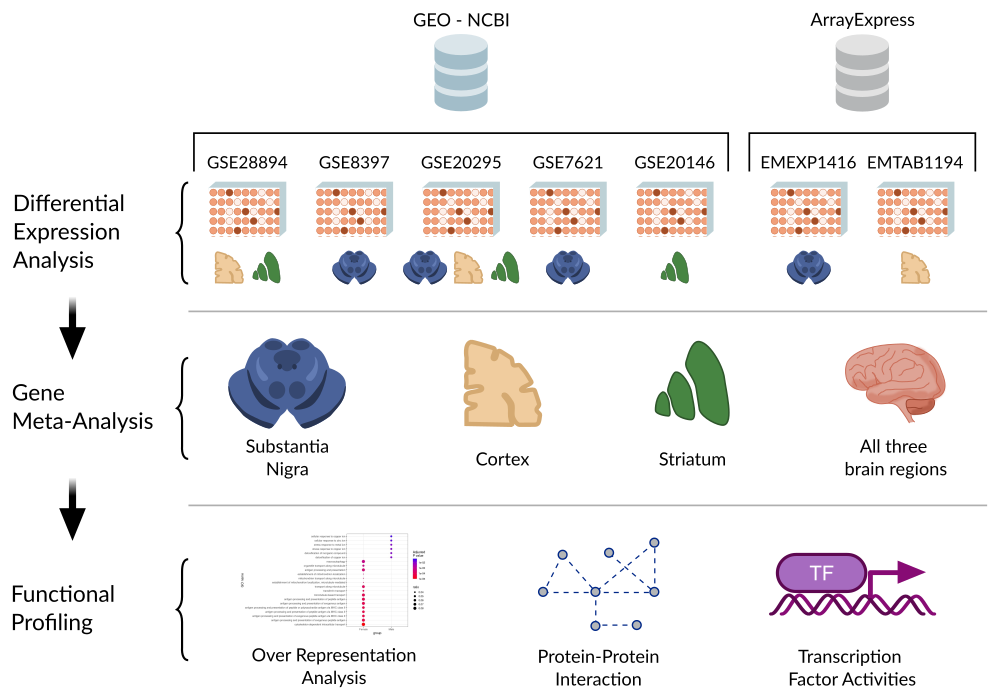
3. Bioinformatics analysis
For each of the selected studies, the same analysis strategy was followed:
- Data download and normalization
- Exploratory analysis
- Differential gene level expression analysis (DGE)
- Integration for DGE results using meta-analysis techniques, taking into account the tissue of origin of the samples (blood, nervous and both), to obtain robust results across all studies
- Functional enrichment (GSEA) of the meta-analysis (Figure 1)
3.1 Differential gene expression
After downloading and normalizing the data, several differential expression analyses (DGE) were performed, for each individual study, to detect genetic differences between groups. First, we designed a contrast, to detect sex-related differencies in MS, in which we subtracted from women with MS the factor of being female, from men with MS we subtracted the factor of being male, and finally we compared the two subtractions by the comparison: (MS.Women - Ctrl.Women) - (MS.Men - Ctrl.Men). Additionally, differential expression analysis was also performed to discover which genes are affected in females (MS.Women - Ctrl.Women) and males (MS.Men - Ctrl.Men) with the disease. Comparative analysis of these results constitutes another approach for the detection of sex differences in MS. All comparisons were performed using the R package limma [5]. After calculation of the differential expression statistics, the p-values were adjusted by the Benjamini & Hochberg (BH) method.
3.2. Meta-analysis
To robustly integrate the results of the DGEs of each study, meta-analysis techniques were used. The results of each of the three comparisons were combined separately:. (MS.Women - Ctrl.Women) - (MS.Men - Ctrl.Men), (MS.Women - Ctrl.Women) and (MS.Men - Ctrl.Men). For each comparison, 3 meta-analyses were performed according to the tissue of origin of the samples: blood, nervous tissue or both tissues. In the latter case, only genes detected in at least one study from each of the two tissue types are integrated. The meta-analyses were performed following the methodology described by García-García [6]. Briefly, the metafor R package [7] was used to combine the results of the corresponding individual studies, using a random-effects model [18]. Likewise, variability in the individual studies was considered in the global estimation of the measured effect so that less-variable results had a higher weight in the overall calculation of the logarithm of the odds ratio (LOR) [9]. Incorporating the variability between experiments in the model of random effects provides more statistically robust results and better integration of selected studies. The suitability of this method was tested by assessing the heterogeneity and influence of each study on the overall model, and cross-validation techniques. For each element (gene, process or pathway), the meta-analysis calculates the BH-adjusted p-value, the LOR and its 95% confidence interval. Those elements with an adjusted p-value < 0.05 were considered significant.
3.3 Functional enrichment analysis
To detect functions or pathways associated to MS disease in the individual women and men contrasts but also sex related, a gene set analysis (GSA) of nervous tissue meta-analyses was performed. Firstly, the genes were ordered according to the p-value and sign of the statistic obtained in the DGE. Next, GSA was performed using the logistic regression model implemented in the mdgsa R package [10]. The logarithm of odds ratio (LOR) is the measure of effect in functional enrichment analysis, and is obtained directly from logistic regression. For example, in the Men.MS - Men.Ctrl contrast, a LOR > 0 informs us that there is a greater overrepresentation of this function in men with MS, while a LOR < 0 would indicate that this function or pathway is more inhibited in men with MS than in Men.Ctrl. The functional annotation required for the GSA was obtained from the following databases: Gene Ontology (GO) [11], in the case of biological processes (BP), and Kyoto Encyclopedia of Genes and Genomes (KEGG) Pathway [12] for pathways. Due to their hierarchical structure, the gene annotations with GO terms applied in the mdgsa package were propagated to inherit the annotations of the ancestor terms. Excessively specific or generic annotations (blocks smaller than ten or larger than 500 words) were subsequently filtered out. Finally, functions with a BH-adjusted p value under 0.05 were considered significant.
References
- R Core Team R: A Language and Environment for Statistical Computing; R Foundation for Statistical Computing: Vienna, Austria, 2019.
- Barrett T, Wilhite SE, Ledoux P, Evangelista C, Kim IF, Tomashevsky M, et al. NCBI GEO: archive for functional genomics data sets—update. Nucleic Acids Res. 2012;41:D991–5.
- Athar A, Füllgrabe A, George N, Iqbal H, Huerta L, Ali A, et al. ArrayExpress update – from bulk to single-cell expression data. Nucleic Acids Res. 2019;47:D711–5.
- Moher D, Liberati A, Tetzlaff J, Altman DG, The PRISMA Group. Preferred Reporting Items for Systematic Reviews and Meta-Analyses: The PRISMA Statement. PLoS Med. 2009;6:e1000097.
- Ritchie ME, Phipson B, Wu D, Hu Y, Law CW, Shi W, et al. limma powers differential expression analyses for RNA-sequencing and microarray studies. Nucleic Acids Res. 2015;43:e47.
- García-García F. Métodos de análisis de enriquecimiento funcional en estudios genómicos. University of Valencia; 2016.
- Viechtbauer W. Conducting Meta-Analyses in R with the metafor Package. J Stat Softw. 2010;36. doi:10.18637/jss.v036.i03.
- DerSimonian R, Laird N. Meta-analysis in clinical trials. Control Clin Trials. 1986;7:177–88.
- Schmidt FL, Hunter JE. Methods of Gene Meta-Analysis: Correcting Error and Bias in Research Findings. 1 Oliver’s Yard, 55 City Road London EC1Y 1SP: SAGE Publications, Ltd; 2015. doi:10.4135/9781483398105.
- Montaner D, Dopazo J. Multidimensional Over-Representation Analysis of Genomic Data. PLoS One. 2010;5:e10348.
- Ashburner M, Ball CA, Blake JA, Botstein D, Butler H, Cherry JM, et al. Gene Ontology: tool for the unification of biology. Nat Genet. 2000;25:25–9.
- Kanehisa M. KEGG: Kyoto Encyclopedia of Genes and Genomes. Nucleic Acids Res. 2000;28:27–30.