Methods
Bioinformatics and statistical analysis were run in R software v.3.5.3 [1]
1. Study search and selection
Publicly available datasets were collected from GEO [2], ArrayExpress [3], and TCGA [4]. A systematic search of studies was conducted between September 2018 and January 2019 following the preferred reporting items for systematic reviews and meta-analyses (PRISMA) guidelines [5]. Several keywords were employed in the search, including lung adenocarcinoma (ADC), non-small-cell lung carcinoma (NSCLC), Homo sapiens and excluding cell lines. 11 variables were taken into account to evaluate each individual study, including clinical characteristics of the patients (e.g., sex and smoking habit) and experimental design (e.g., sample size and sample extraction source). The final inclusion criteria were:
- Sex, disease stage and smoking habit variables were registered
- RNA was extracted directly from human lung biopsies
- Both normal and lung ADC samples were available
- Patients had not undergone treatment prior to biopsy
- Sample size was > 3 for case and control groups in both sexes
Finally, normalized gene expression data of 6 array NSCLC datasets (GSE10072, GSE19188, GSE31210, GSE32863, GSE63459 and GSE75037) and counts matrix of 3 RNA-seq NSCLC datasets (GSE81089, GSE87340 and TCGA-LUAD) were retrieved.
2. Individual transcriptomics analysis
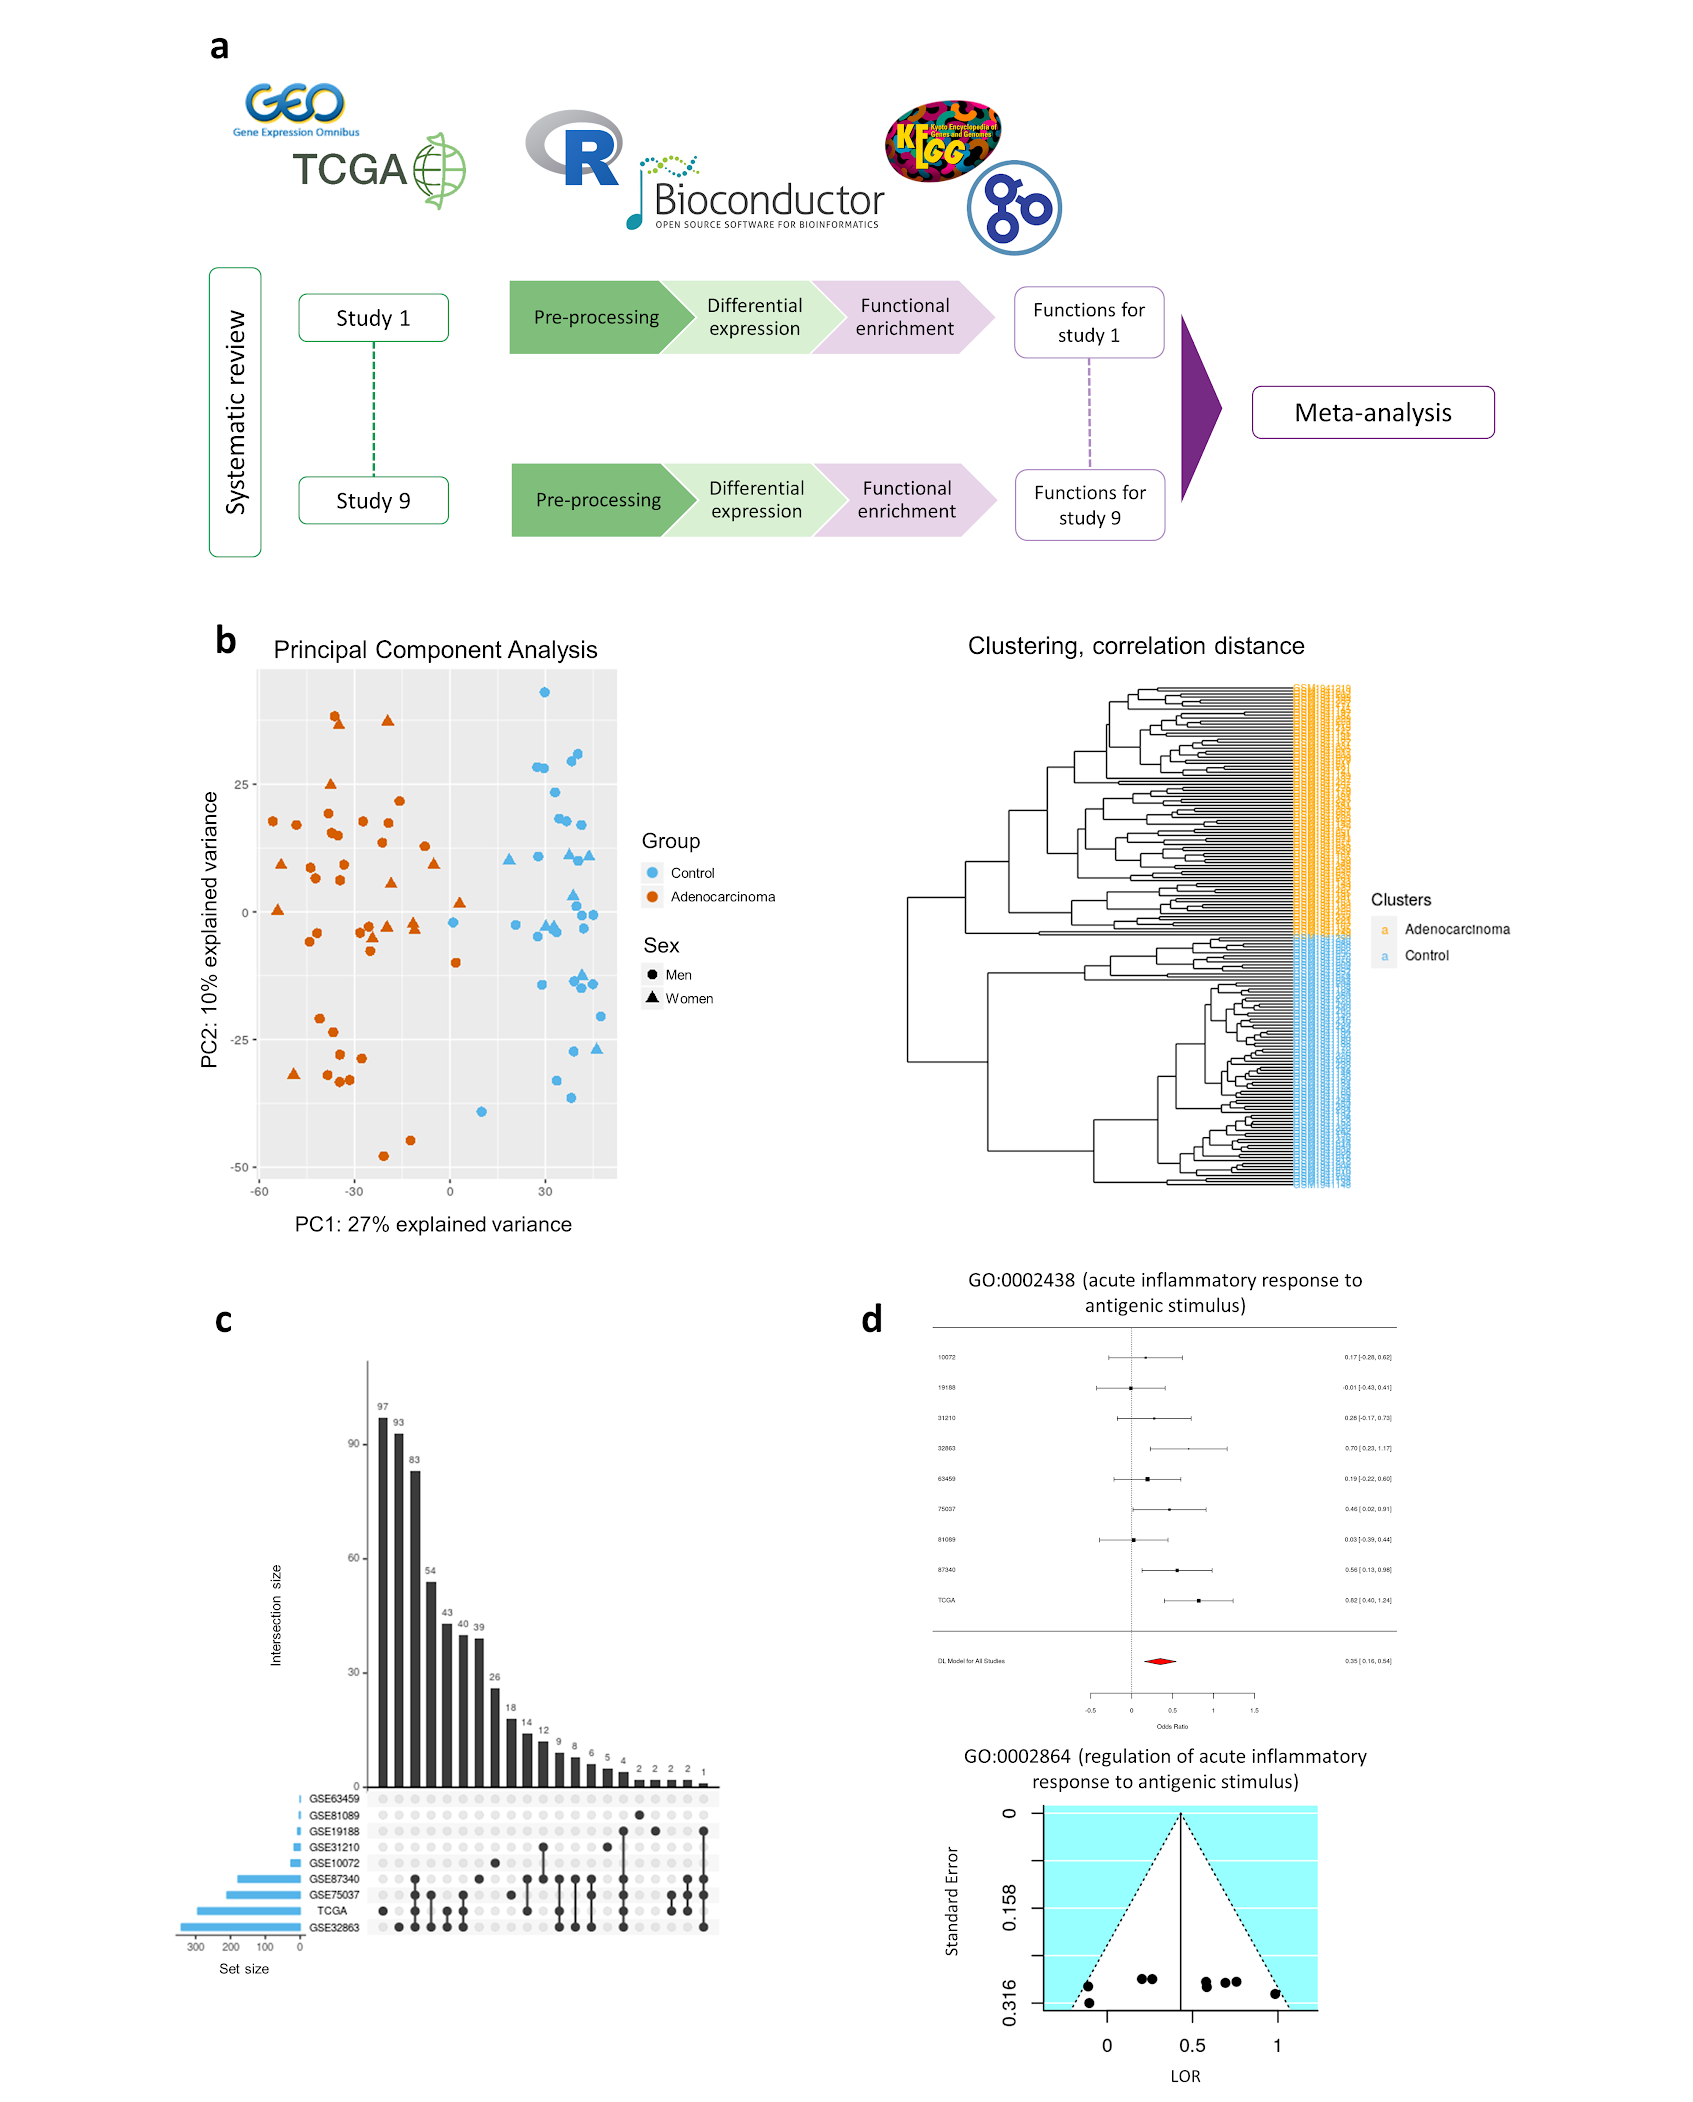
Individual transcriptomics analysis consisted of three steps: pre-processing, differential expression analysis, and functional enrichment analysis (Figure 1a). Data preprocessing included the standardization of the nomenclature of the clinical variables included in each study, normalization of RNA-seq counts matrix and exploratory analysis. RNA-seq counts were pre-processed with the edgeR [6] R package using the trimmed mean of m-values (TMM) method [7]. Annotation from probe set to Entrez identifiers from National Center for Biotechnology Information [8] database and gene symbol was carried out with the biomaRt [9] R package. When dealing with duplicated probe-to-entrez mappings, the median of their expression values was calculated. The exploratory analysis included unsupervised clustering and principal component analysis (PCA), to detect patterns of expression between samples and genes, and the presence of batch effect in each study (Figure 1b). Differential expression analyses were performed using the limma [10] R package. To detect differentially expressed genes in the progression of lung ADC between men and women, the following contrast was applied:
(ADC.W - Control.W) - (ADC.M - Control.M) where ADC.W, Control.W, ADC.M and Control.M correspond to lung adenocarcinoma affected women, control women, lung adenocarcinoma affected men and control men, respectively. Paired samples design was implemented and tobacco consumption was included as a batch effect to reduce its impact on data. P-values were calculated and corrected for False Discovery Rate (FDR) [11]. This comparison allows us to detect which genes and functions have been altered by the disease and have higher or lower activity in women when compared to men. Significant functions and genes were considered when FDR < 0.05. Functional enrichment analyses were performed using Gene Set Enrichment Analysis (GSEA) implemented in the mdgsa [12] R package. P-values were, again, corrected for FDR. For functional annotation, two functional databases were used: Kyoto Encyclopedia of Genes and Genomes (KEGG) Pathway database [13], and Gene Ontology (GO) [14]. GO terms were analyzed and propagated independently for each GO ontology: biological processes (BP), molecular functions (MF) and cellular components (CC). Those annotations excessively specific or generic were filtered, keeping functions with blocks of annotations between 10 and 500. Intersections within groups were analyzed with UpSet plots [15] (Figure 1c).
3. Functional meta-analysis
Functional GSEA results were integrated into a single functional meta-analysis [16] implemented with mdgsa and metafor [17] R packages. Meta-analysis was applied under the DerSimonian & Laird random-effects model [18], taking into account individual study heterogeneity. This model takes into account the variability of individual studies by increasing the weights of studies with less variability when computing meta-analysis results. Thus, the most robust functions between studies are highlighted. A total of 6.330 GO BP terms, 745 GO CC terms, 1193 GO MF terms and 212 KEGG pathways were evaluated. P-values, FDR corrected p-values, the logarithm of odds ratios (LOR) and 95% confidence intervals (CI) were calculated for each evaluated function. Functions and pathways with FDR < 0.05 were considered significant, and both funnel and forest plots were computed for each one (Figure 1d). Funnel plots were analyzed to assess for possible biased results, where LOR represents the effect size of a function and the standard error (SE) of the LOR serves as a study precision measure [19].
References
- R Core Team R: A Language and Environment for Statistical Computing; R Foundation for Statistical Computing: Vienna, Austria, 2014.
- Edgar, R.; Domrachev, M.; Lash, A.E. Gene Expression Omnibus: NCBI gene expression and hybridization array data repository. Nucleic Acids Res. 2002, 30, 207–210, doi:10.1093/nar/30.1.207.
- Athar, A.; Füllgrabe, A.; George, N.; Iqbal, H.; Huerta, L.; Ali, A.; Snow, C.; Fonseca, N.A.; Petryszak, R.; Papatheodorou, I.; et al. ArrayExpress update - from bulk to single-cell expression data. Nucleic Acids Res. 2019, 47, D711–D715, doi:10.1093/nar/gky964.
- Weinstein, J.N.; Collisson, E.A.; Mills, G.B.; Shaw, K.R.M.; Ozenberger, B.A.; Ellrott, K.; Shmulevich, I.; Sander, C.; Stuart, J.M. The Cancer Genome Atlas Pan-Cancer analysis project. Nat. Genet. 2013, 45, 1113–1120, doi:10.1038/ng.2764.
- Moher, D.; Liberati, A.; Tetzlaff, J.; Altman, D.G.; Group, T.P. Preferred Reporting Items for Systematic Reviews and Meta-Analyses: The PRISMA Statement. PLOS Med. 2009, 6, e1000097, doi:10.1371/journal.pmed.1000097.
- Robinson, M.D.; McCarthy, D.J.; Smyth, G.K. edgeR: a Bioconductor package for differential expression analysis of digital gene expression data. Bioinformatics 2010, 26, 139–140, doi:10.1093/bioinformatics/btp616.
- Robinson, M.D.; Oshlack, A. A scaling normalization method for differential expression analysis of RNA-seq data. Genome Biol. 2010, 11, R25, doi:10.1186/gb-2010-11-3-r25.
- Maglott, D.; Ostell, J.; Pruitt, K.D.; Tatusova, T. Entrez Gene: gene-centered information at NCBI. Nucleic Acids Res. 2005, 33, D54–D58, doi:10.1093/nar/gki031.
- Durinck, S.; Moreau, Y.; Kasprzyk, A.; Davis, S.; De Moor, B.; Brazma, A.; Huber, W. BioMart and Bioconductor: a powerful link between biological databases and microarray data analysis. Bioinformatics 2005, 21, 3439–3440, doi:10.1093/bioinformatics/bti525.
- Ritchie, M.E.; Phipson, B.; Wu, D.; Hu, Y.; Law, C.W.; Shi, W.; Smyth, G.K. limma powers differential expression analyses for RNA-sequencing and microarray studies. Nucleic Acids Res. 2015, 43, e47–e47, doi:10.1093/nar/gkv007.
- Benjamini, Y.; Hochberg, Y. Controlling the False Discovery Rate: A Practical and Powerful Approach to Multiple Testing. J. R. Stat. Soc. Ser. B Methodol. 1995, 57, 289–300.
- Montaner, D.; Dopazo, J. Multidimensional Gene Set Analysis of Genomic Data. PLOS ONE 2010, 5, e10348, doi:10.1371/journal.pone.0010348.
- Kanehisa, M.; Goto, S. KEGG: Kyoto Encyclopedia of Genes and Genomes. Nucleic Acids Res. 2000, 28, 27–30, doi:10.1093/nar/28.1.27.
- Ashburner, M.; Ball, C.A.; Blake, J.A.; Botstein, D.; Butler, H.; Cherry, J.M.; Davis, A.P.; Dolinski, K.; Dwight, S.S.; Eppig, J.T.; et al. Gene Ontology: tool for the unification of biology. Nat. Genet. 2000, 25, 25–29, doi:10.1038/75556.
- Lex, A.; Gehlenborg, N.; Strobelt, H.; Vuillemot, R.; Pfister, H. UpSet: Visualization of Intersecting Sets. IEEE Trans. Vis. Comput. Graph. 2014, 20, 1983–1992, doi:10.1109/TVCG.2014.2346248.
- García-García, F. Methods of functional enrichment analysis in genomic studies, Universitat de València: València, 2016.
- Viechtbauer, W. Conducting Meta-Analyses in R with the metafor Package. J. Stat. Softw. Vol 1 Issue 3 2010 2010.
- DerSimonian, R.; Laird, N. Meta-analysis in clinical trials. Control. Clin. Trials 1986, 7, 177–188, doi:10.1016/0197-2456(86)90046-2.
- Sterne, J.A.C.; Egger, M. Funnel plots for detecting bias in meta-analysis: Guidelines on choice of axis. J. Clin. Epidemiol. 2001, 54, 1046–1055, doi:10.1016/S0895-4356(01)00377-8.