Contrast | Studies | ||||||||
|---|---|---|---|---|---|---|---|---|---|
E_MEXP_1425 | GSE2508 | GSE20950 | GSE29718 | GSE64567 | GSE92405 | GSE141432 | GSE205668 | ||
IO | logFC > 0 | 258 | 413 | - | 0 | 37 | 1.404 | 304 | 307 |
logFC < 0 | 719 | 531 | - | 0 | 106 | 987 | 617 | 1.632 | |
Total | 977 | 944 | - | 0 | 143 | 2.391 | 921 | 1.939 | |
IOM | logFC > 0 | 198 | 124 | - | 0 | 0 | 1.047 | 4 | 4 |
logFC < 0 | 616 | 172 | - | 0 | 0 | 674 | 2 | 59 | |
Total | 814 | 296 | - | 0 | 0 | 1.721 | 6 | 63 | |
IOF | logFC > 0 | 57 | 191 | - | 0 | 13 | 1.275 | 167 | 0 |
logFC < 0 | 57 | 338 | - | 0 | 18 | 1.097 | 201 | 0 | |
Total | 114 | 529 | - | 0 | 31 | 2.372 | 368 | 0 | |
SDIO | logFC > 0 | 0 | 1 | - | 0 | 0 | 635 | 2 | 0 |
logFC < 0 | 0 | 0 | - | 0 | 0 | 763 | 0 | 0 | |
Total | 0 | 1 | - | 0 | 0 | 1.398 | 2 | 0 | |
Total Number of Genes | 21367 | 19891 | 21367 | 19975 | 16589 | 21367 | 35795 | 35949 | |
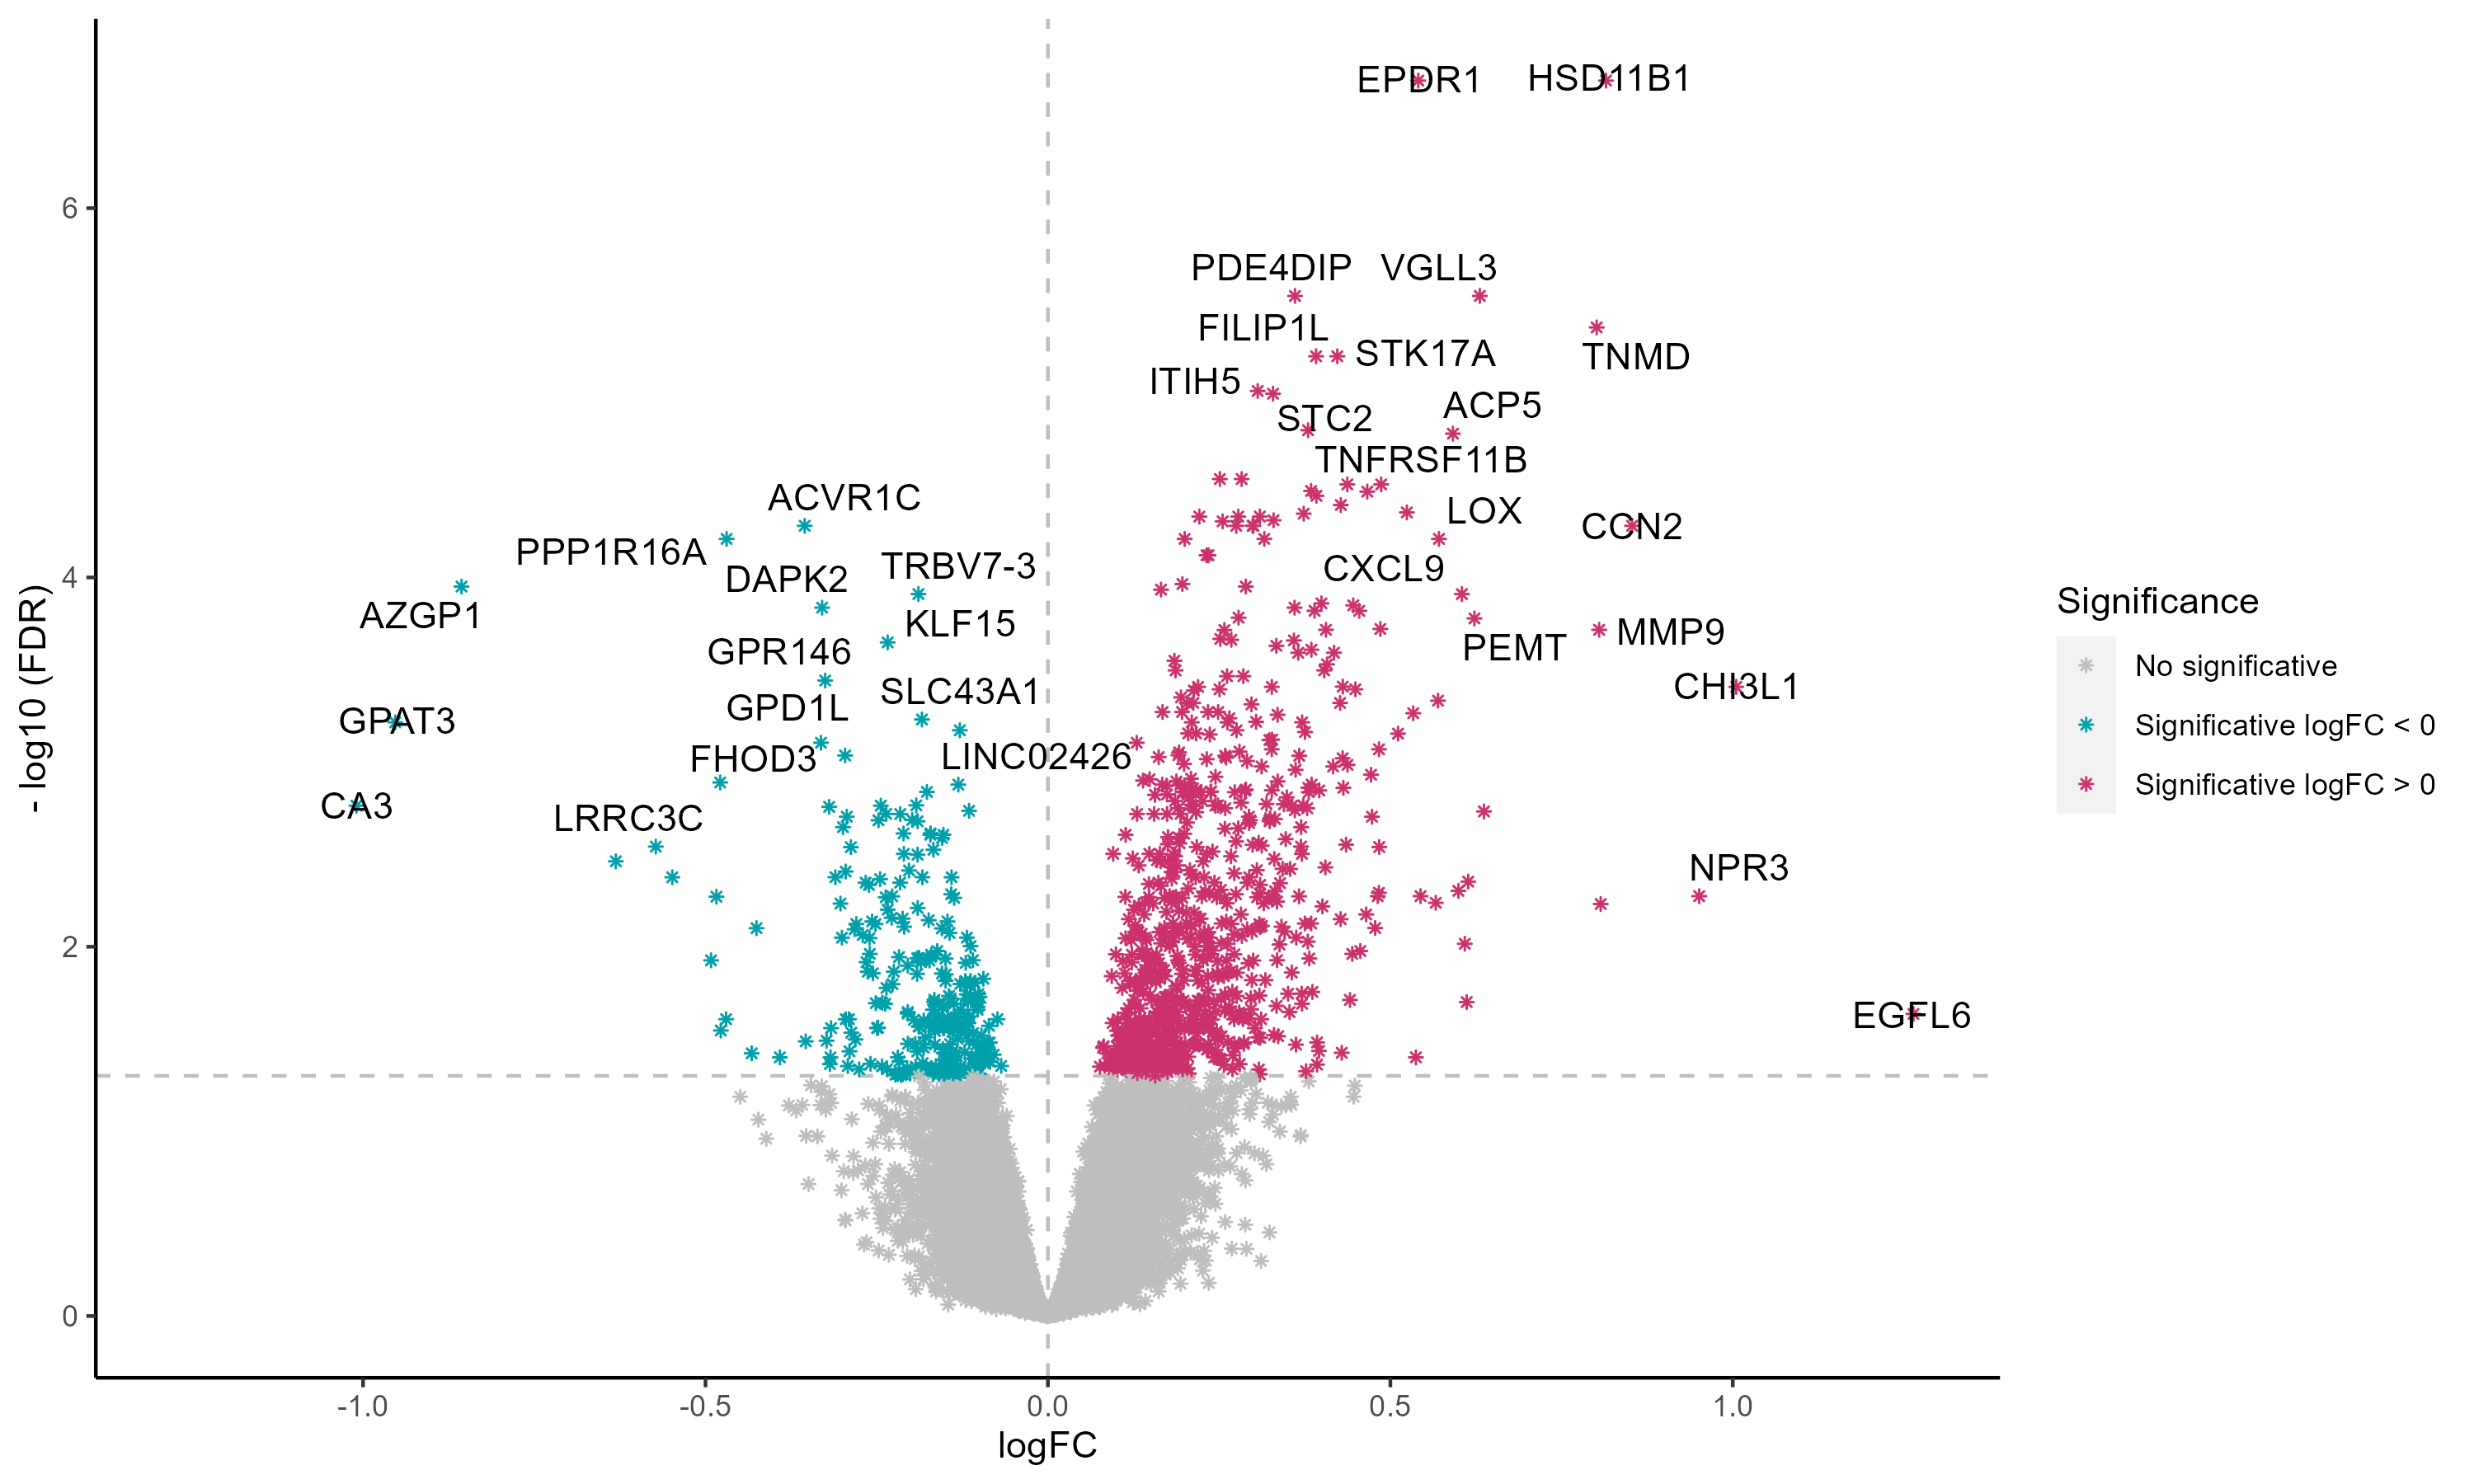
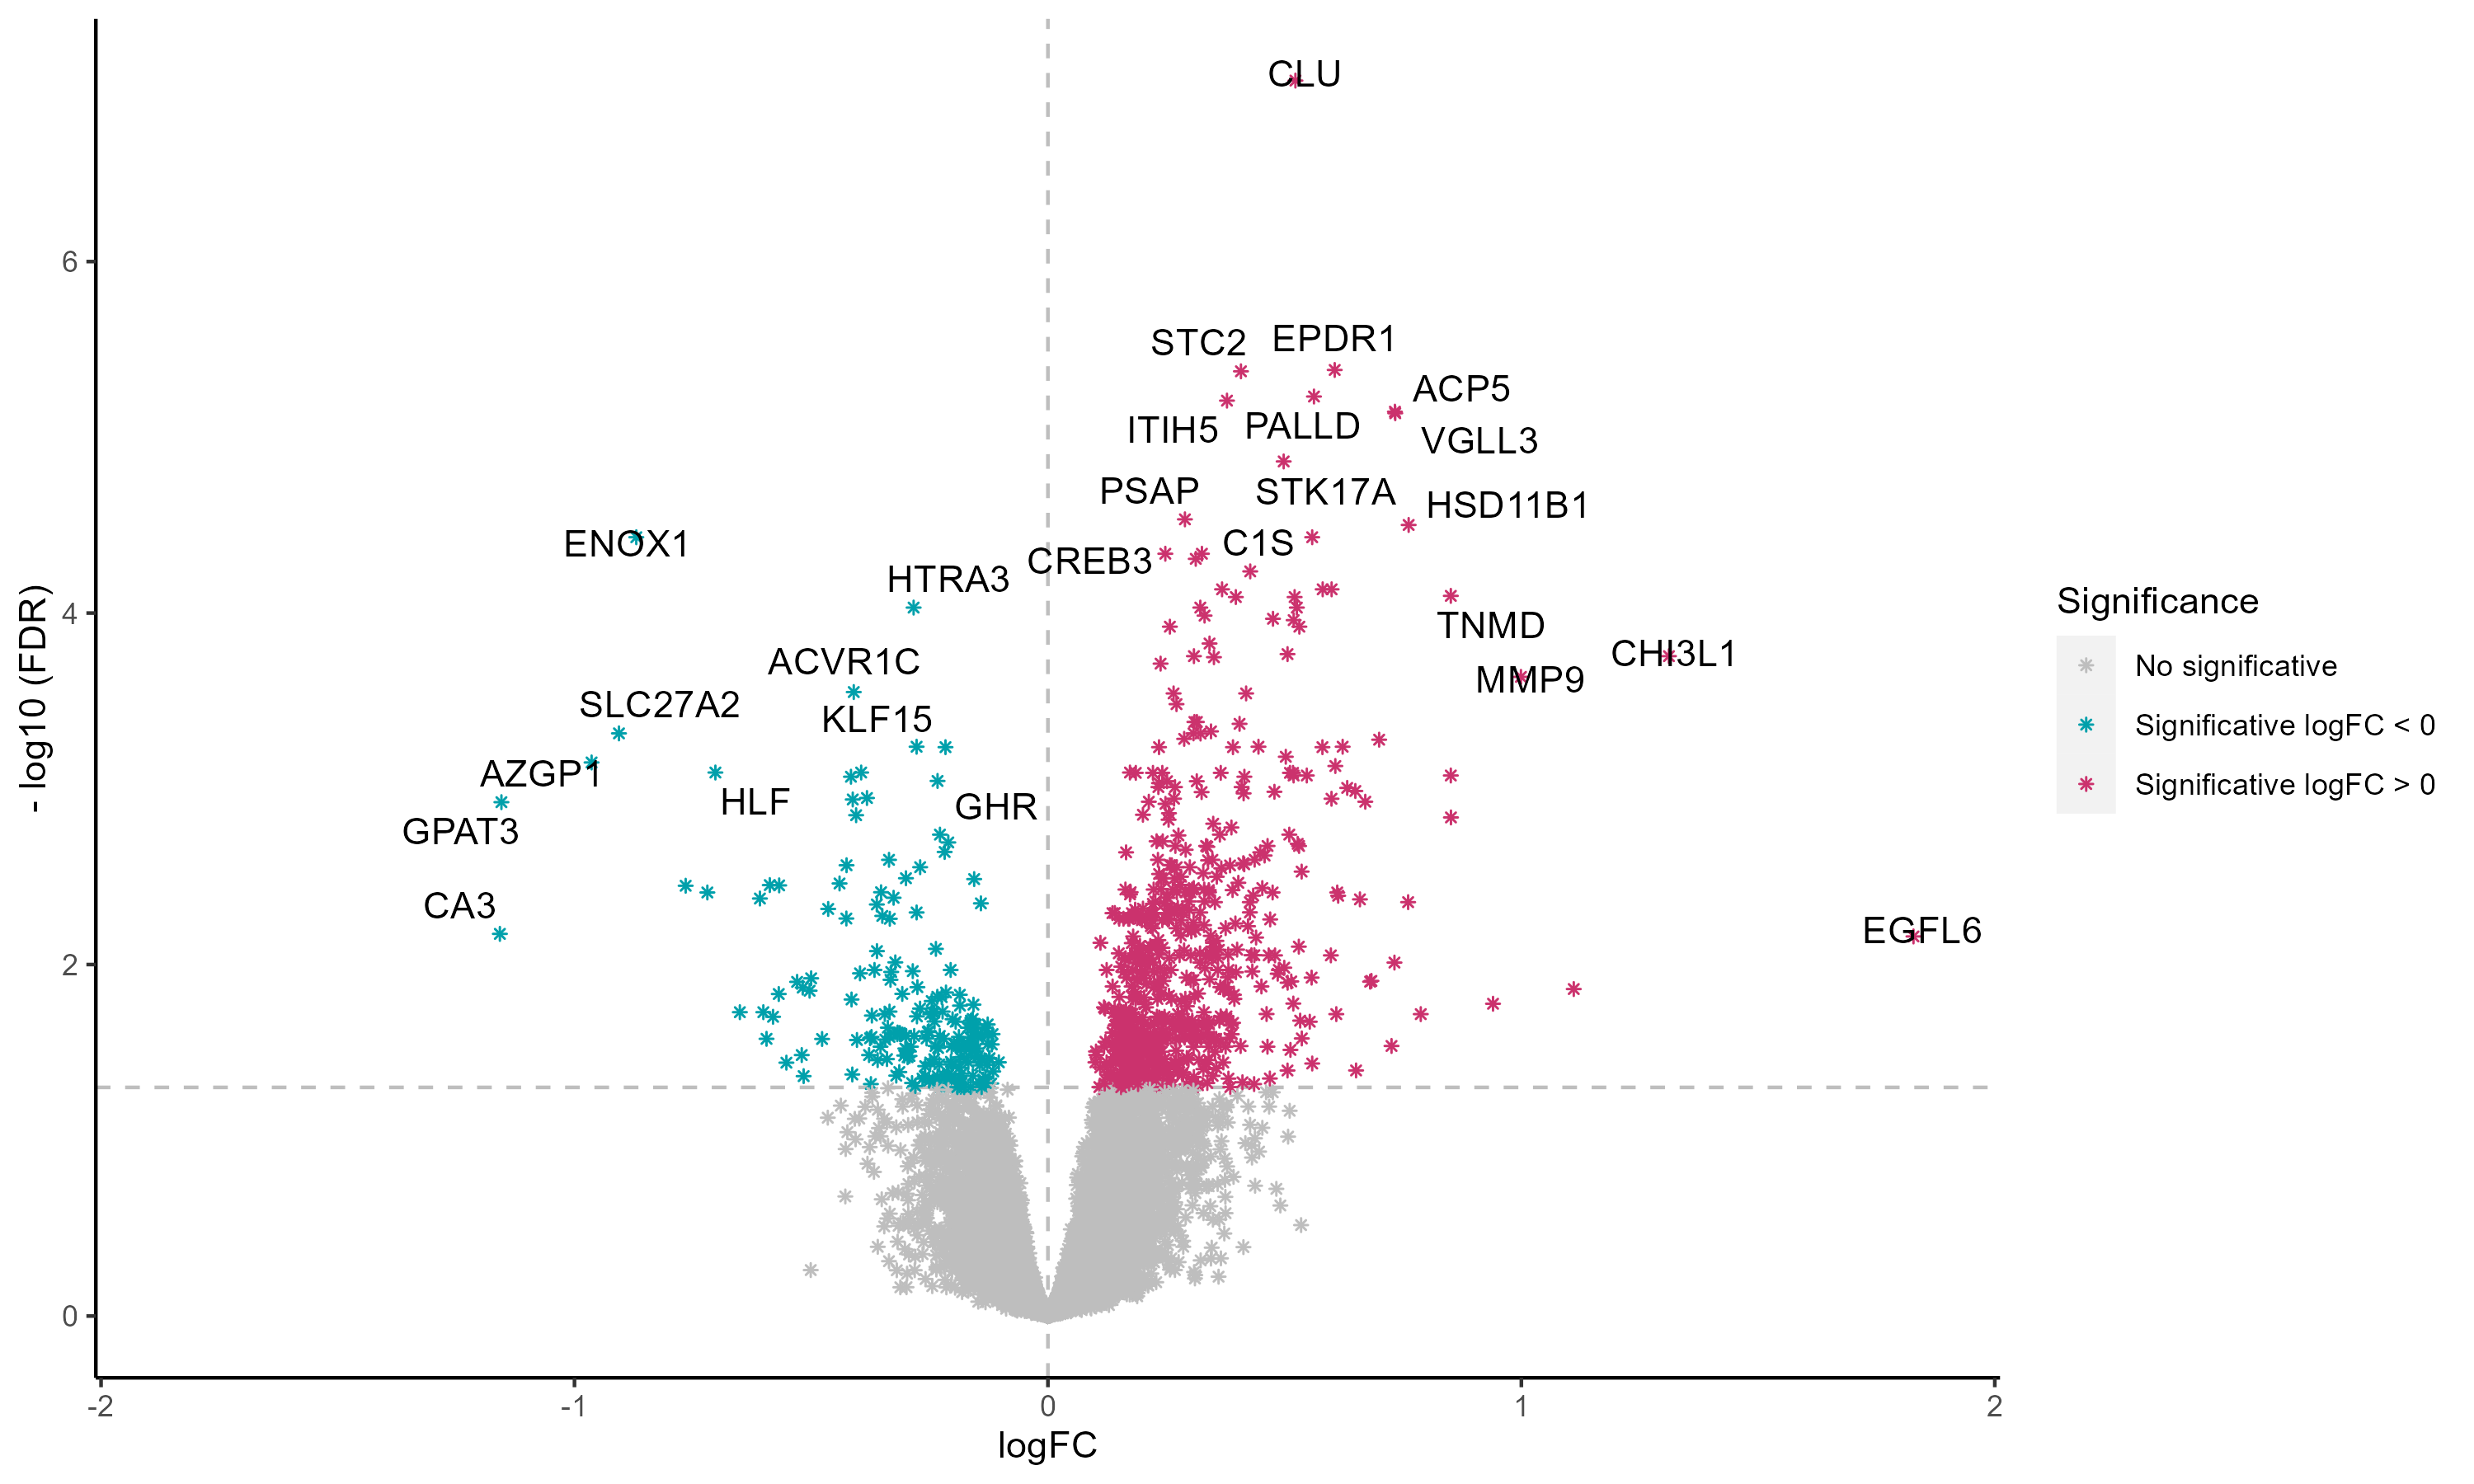
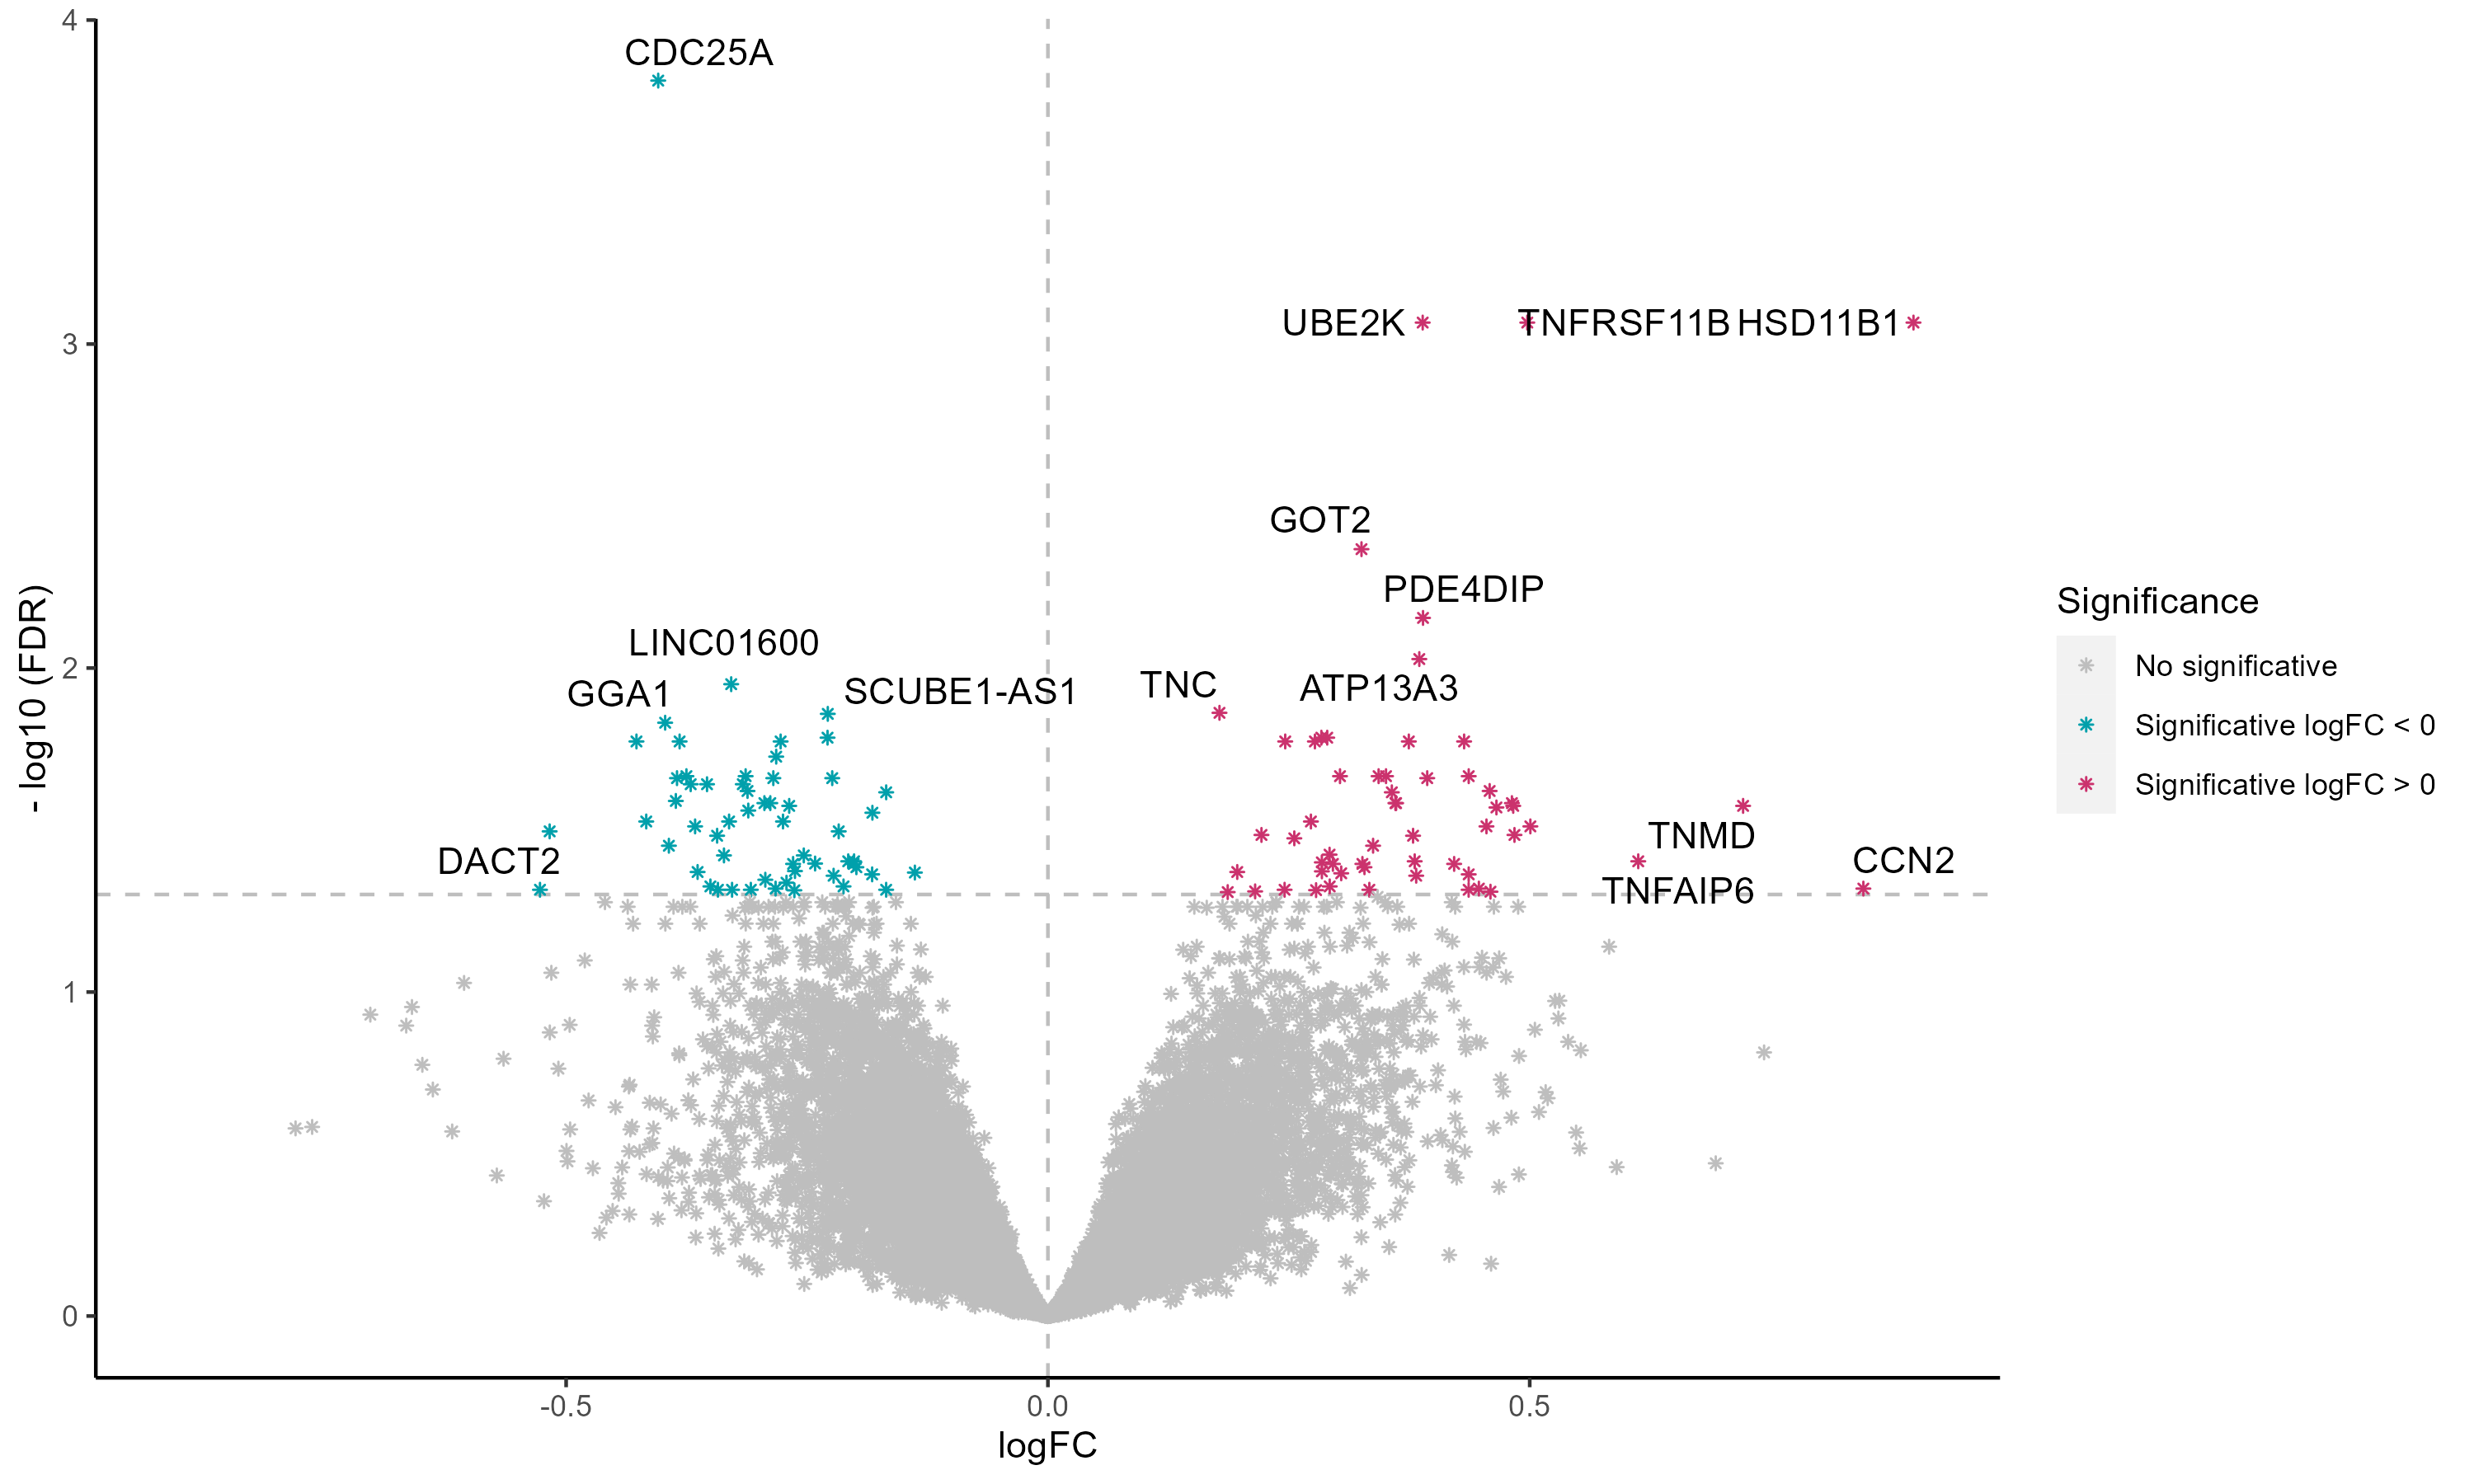
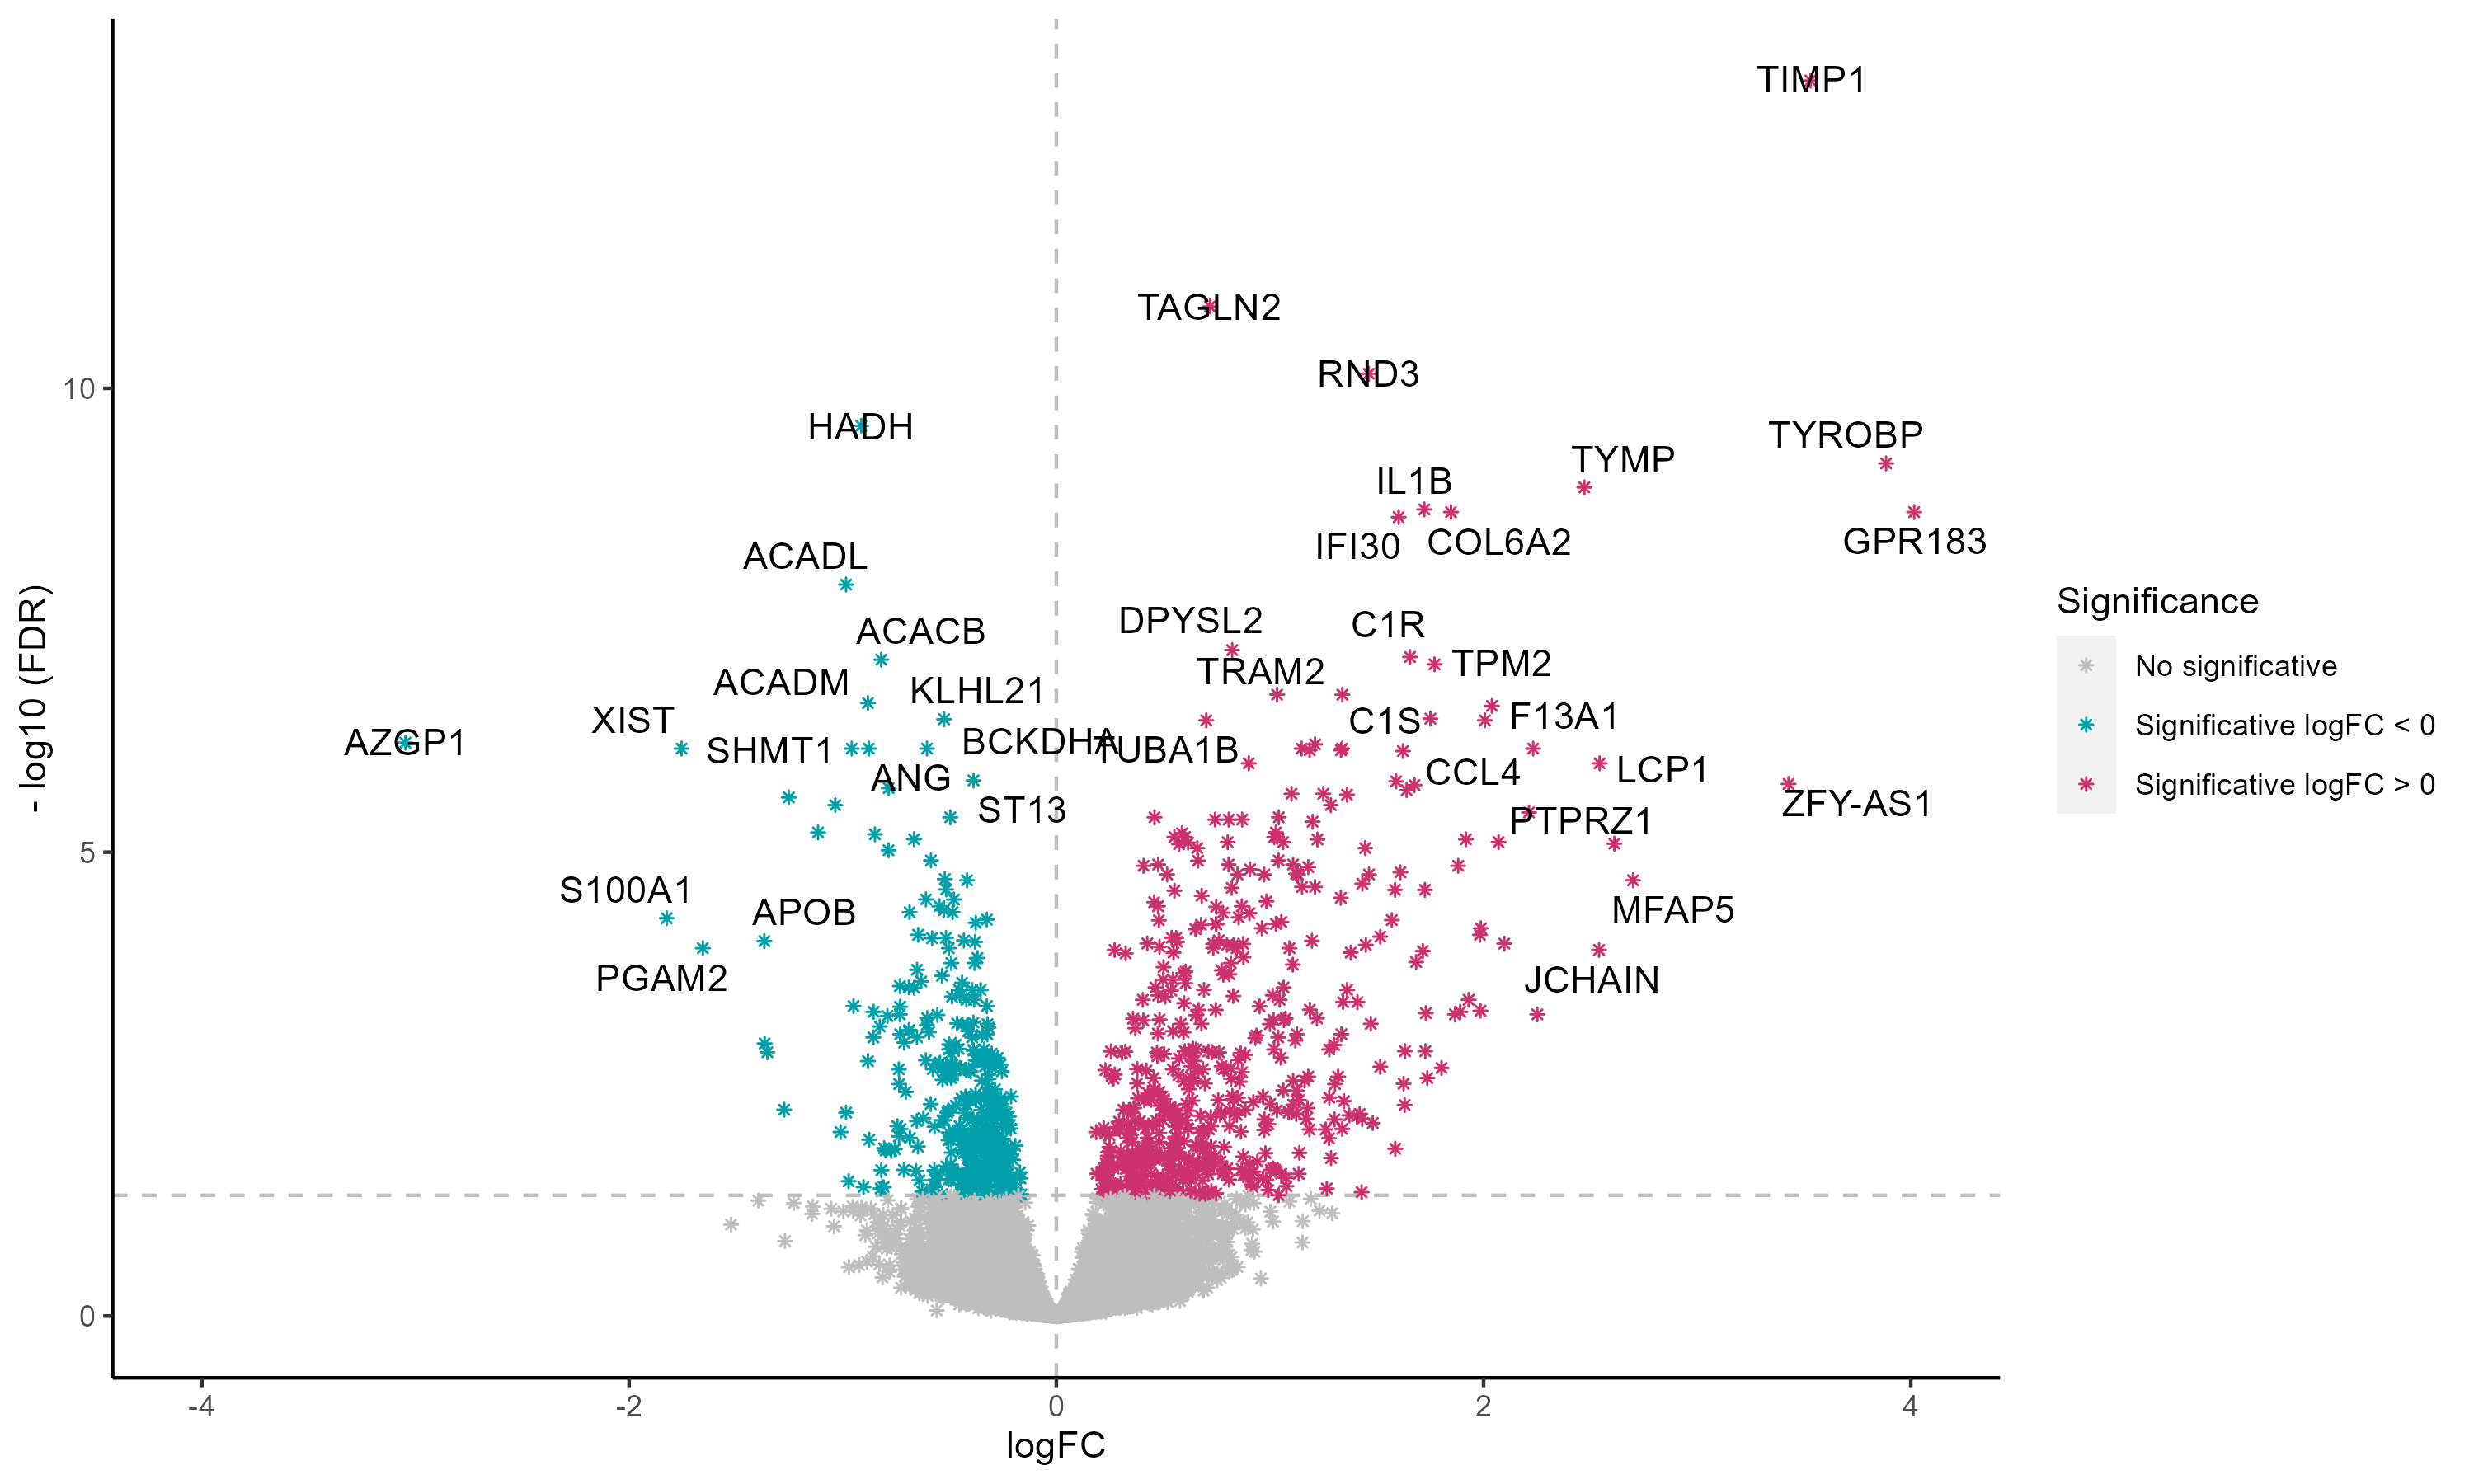
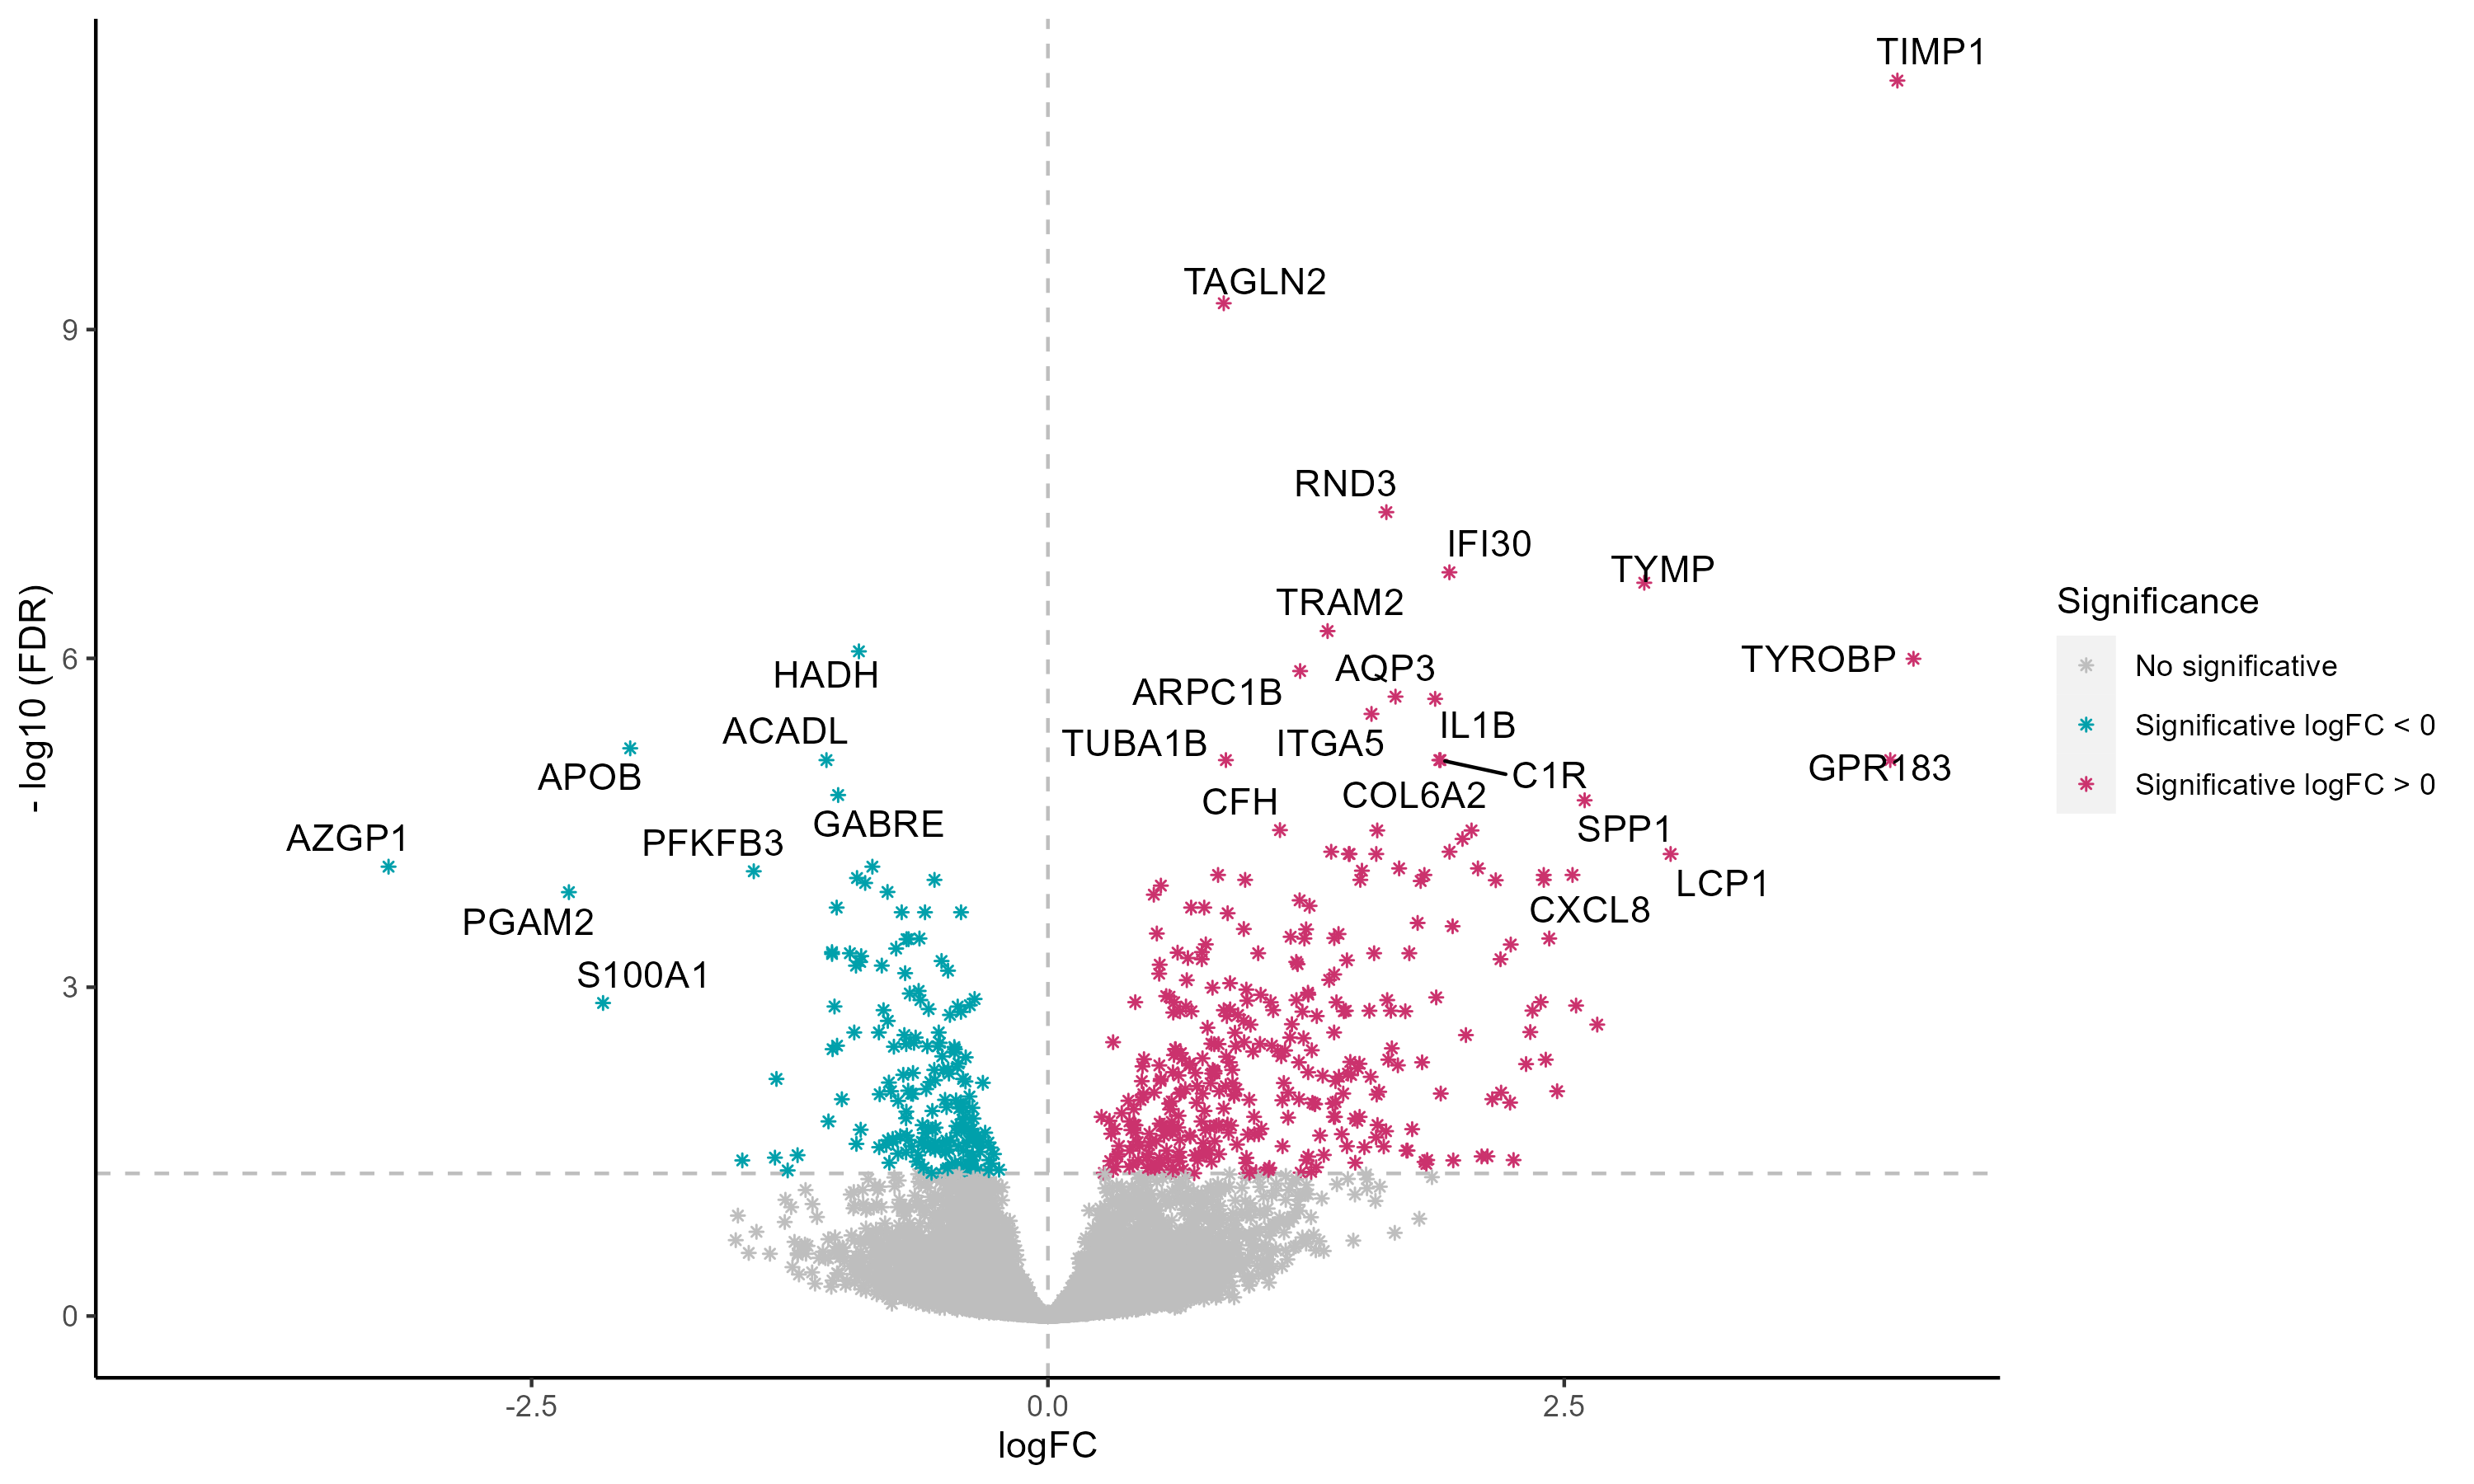
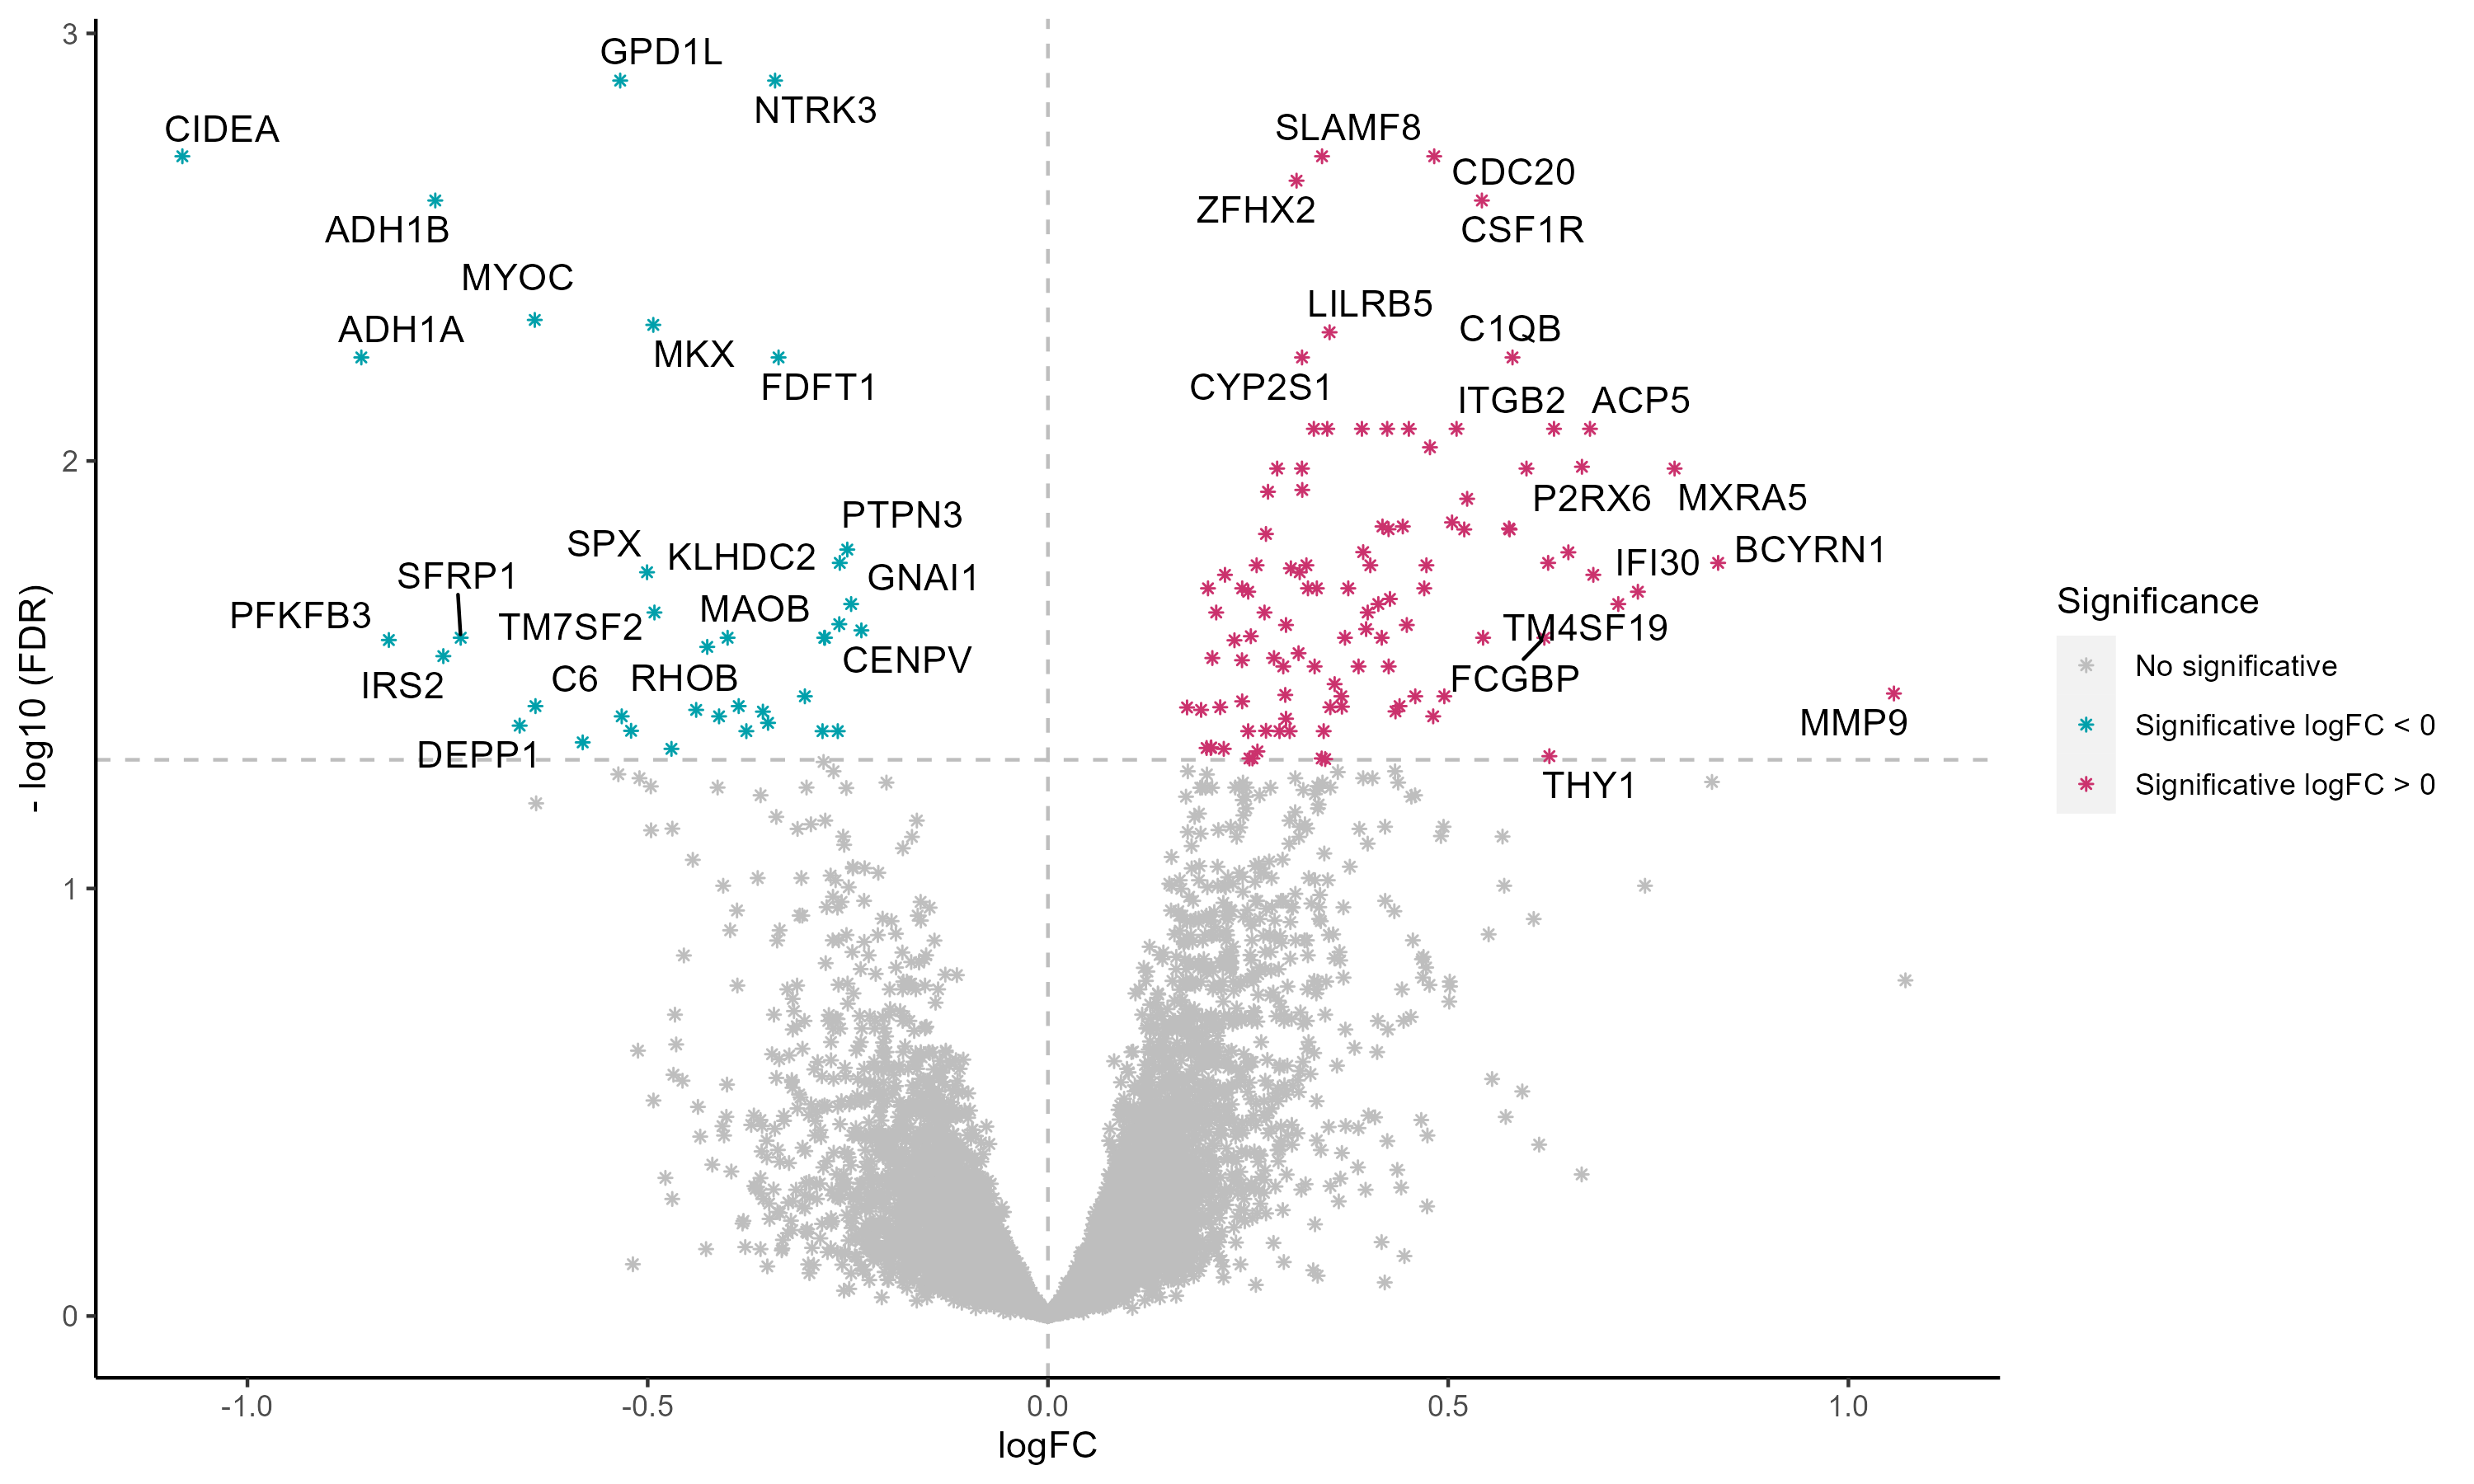
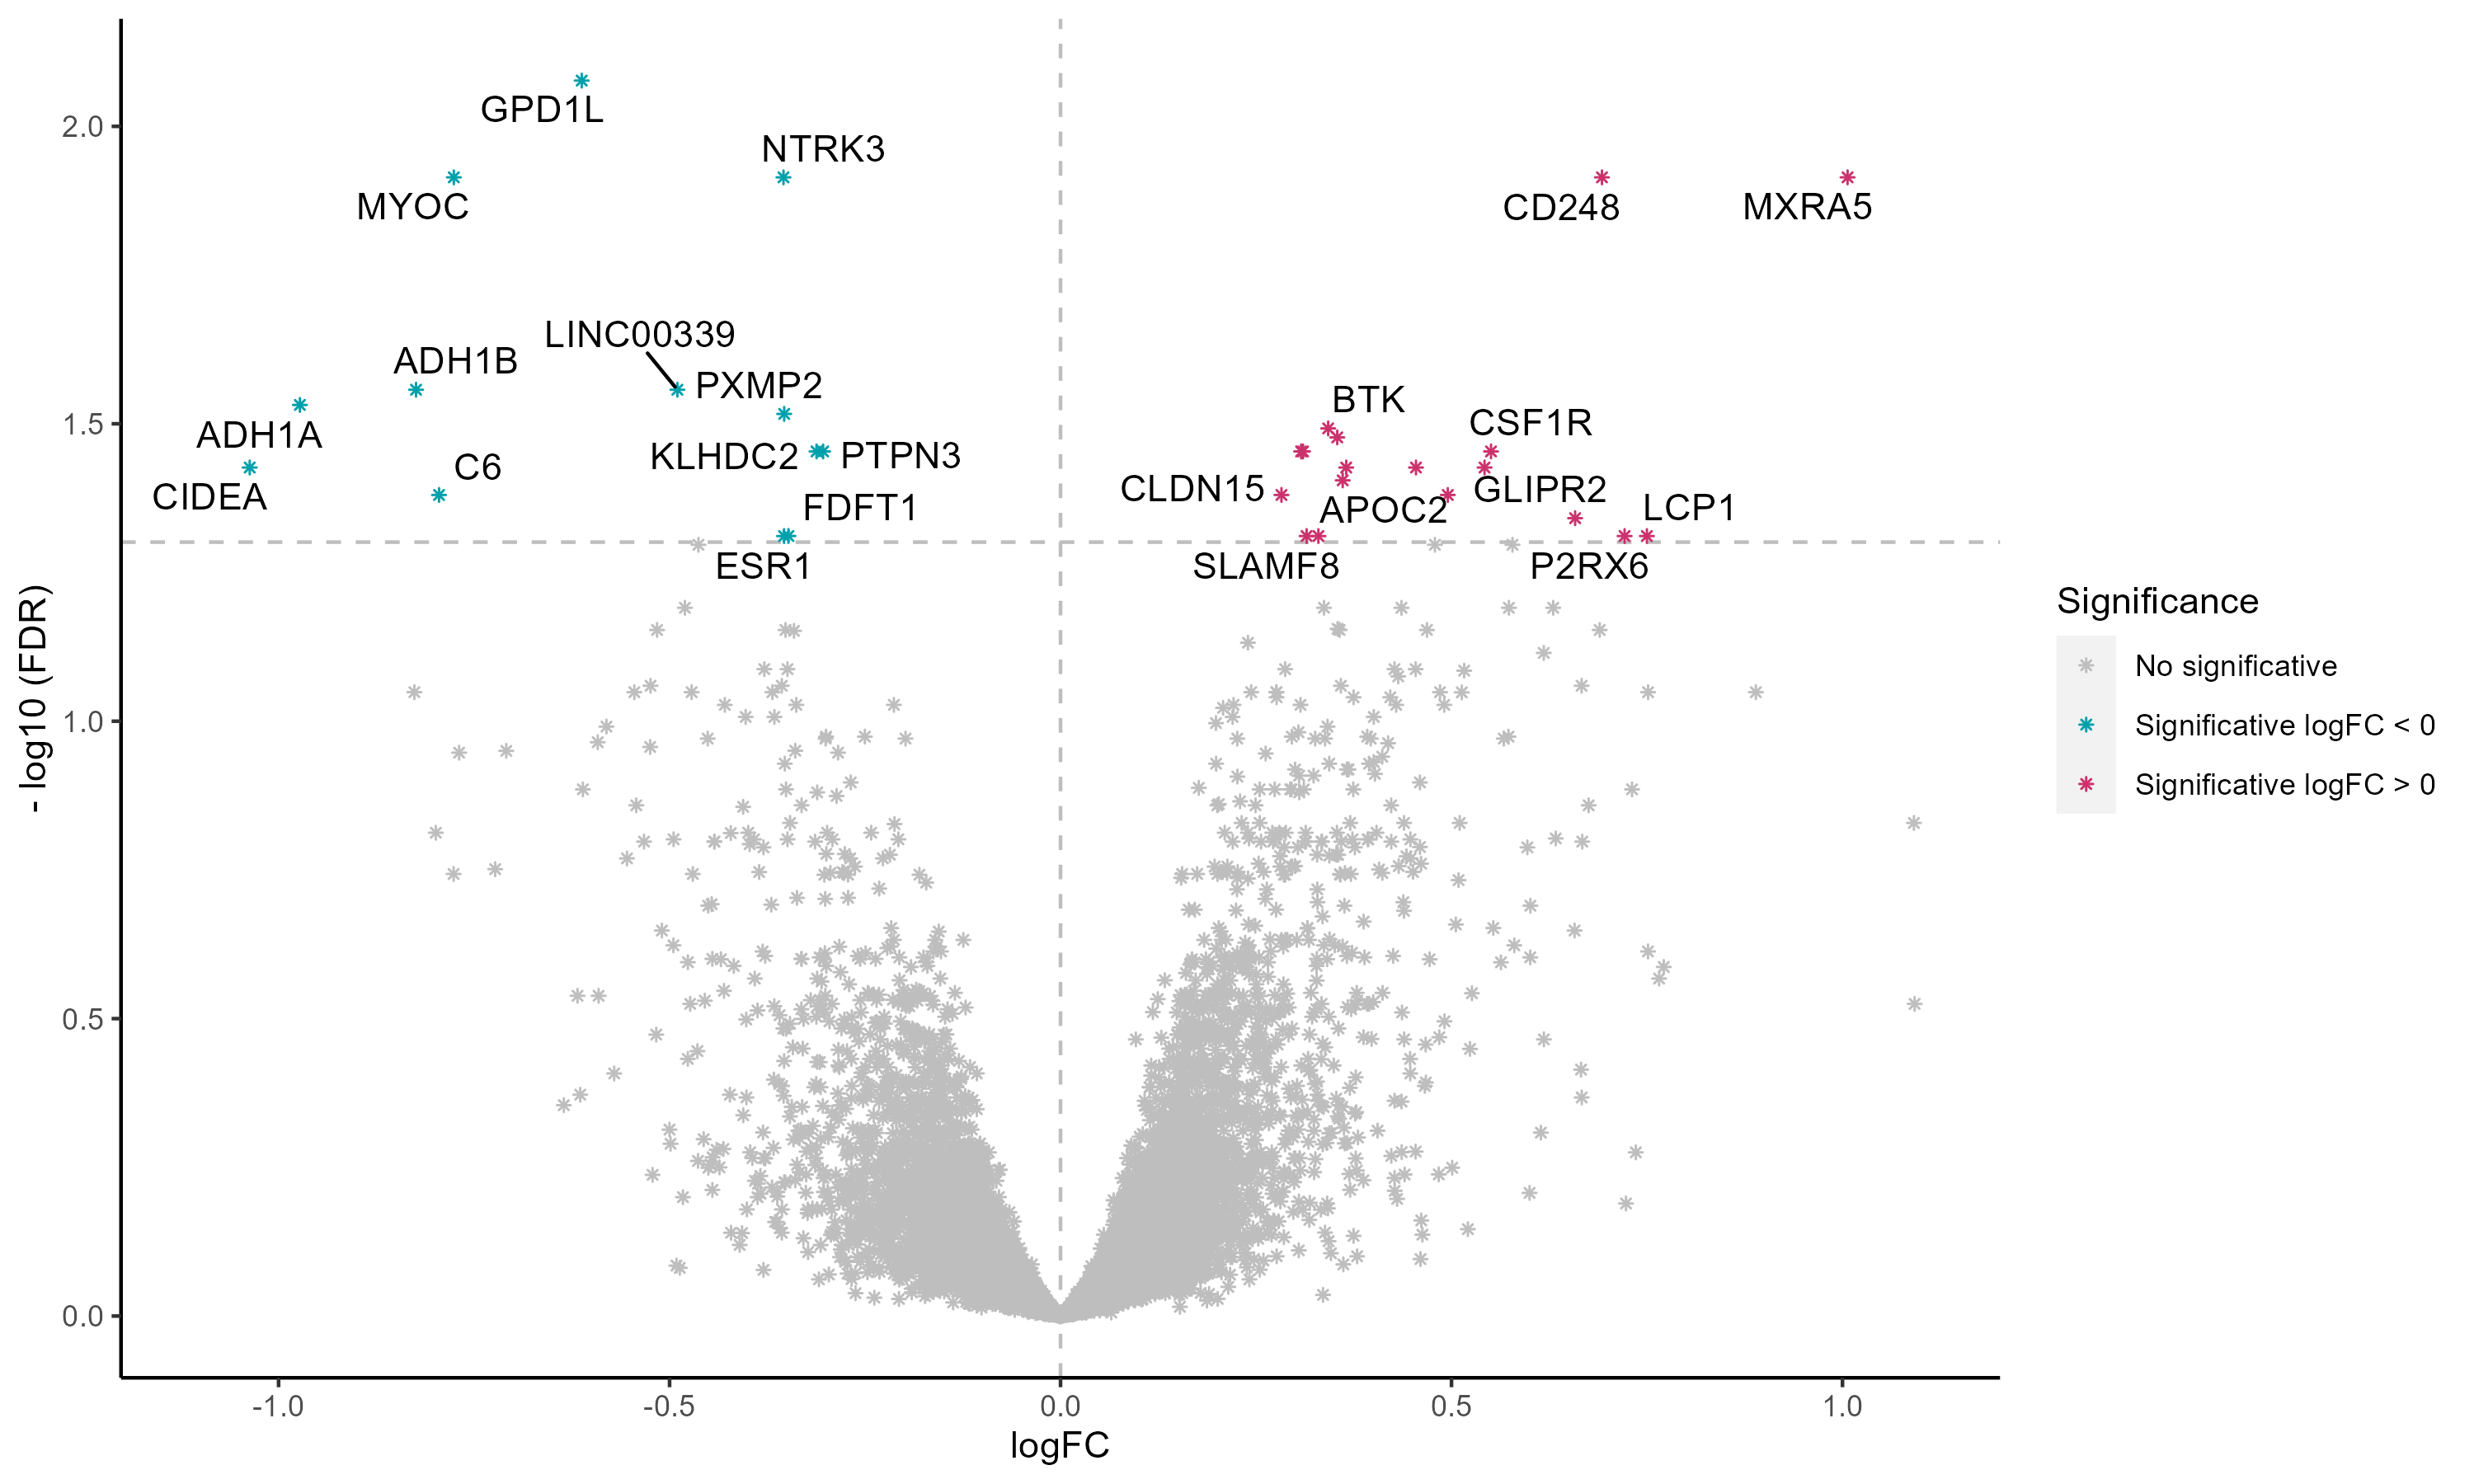
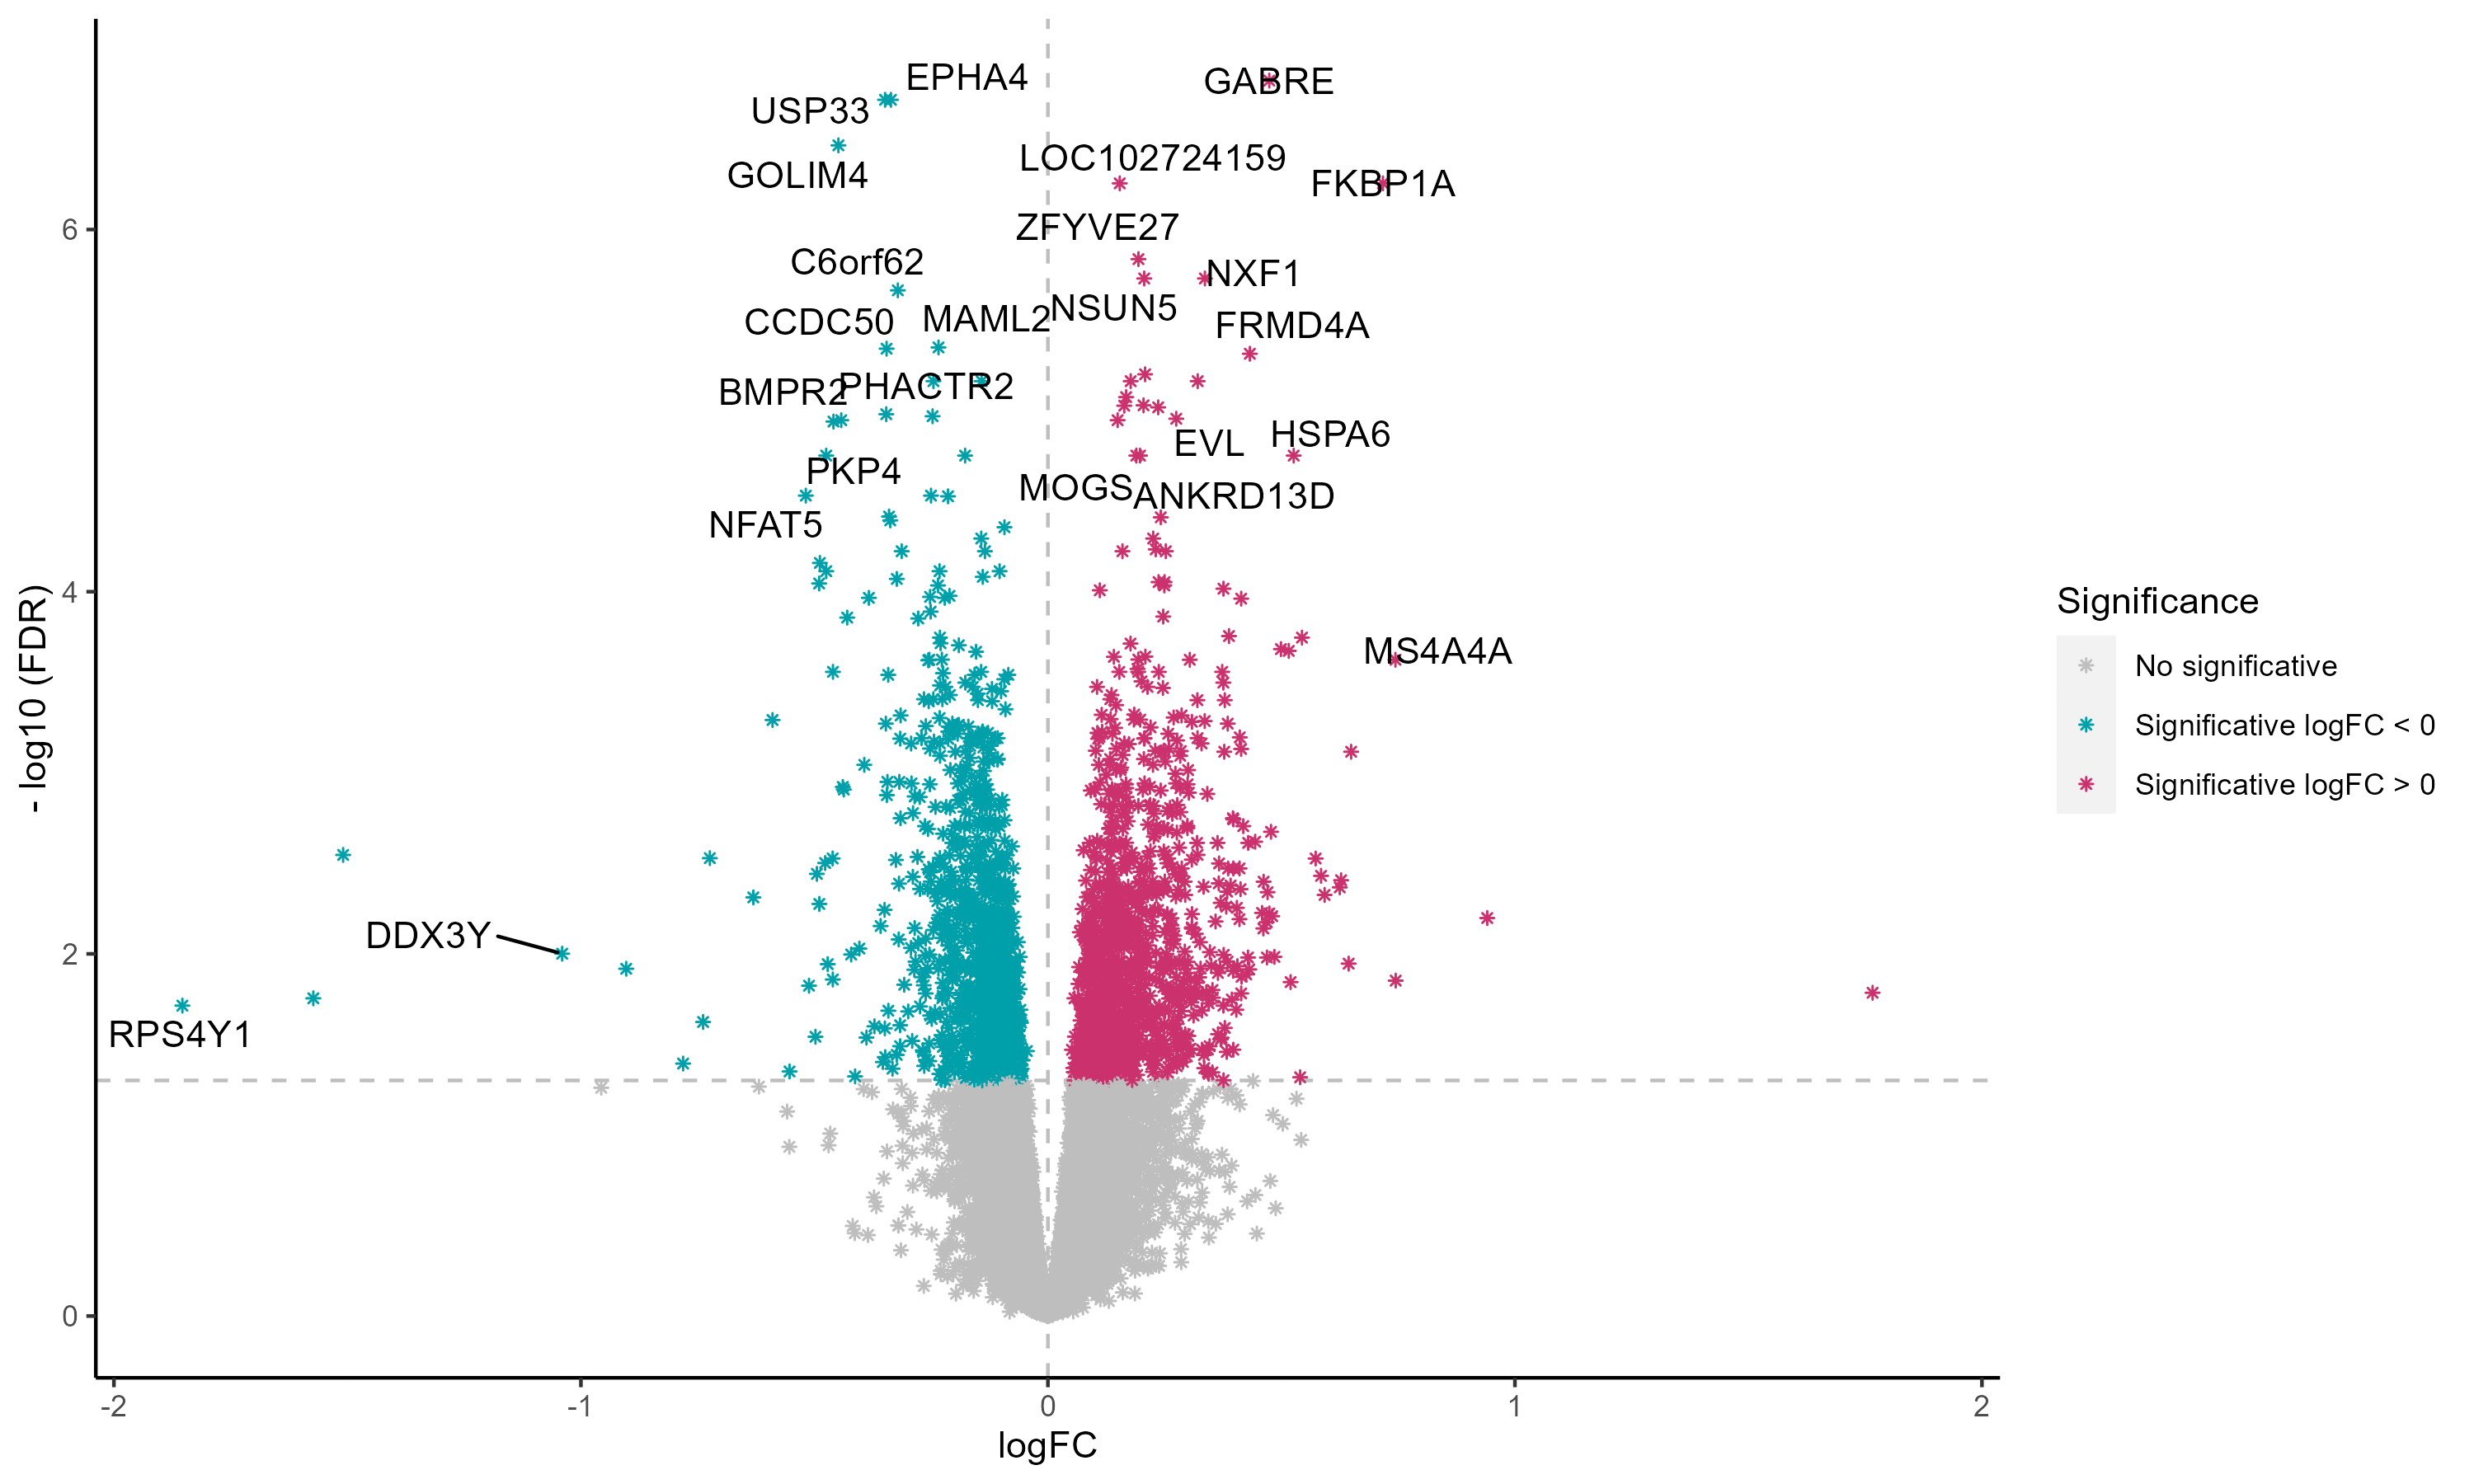
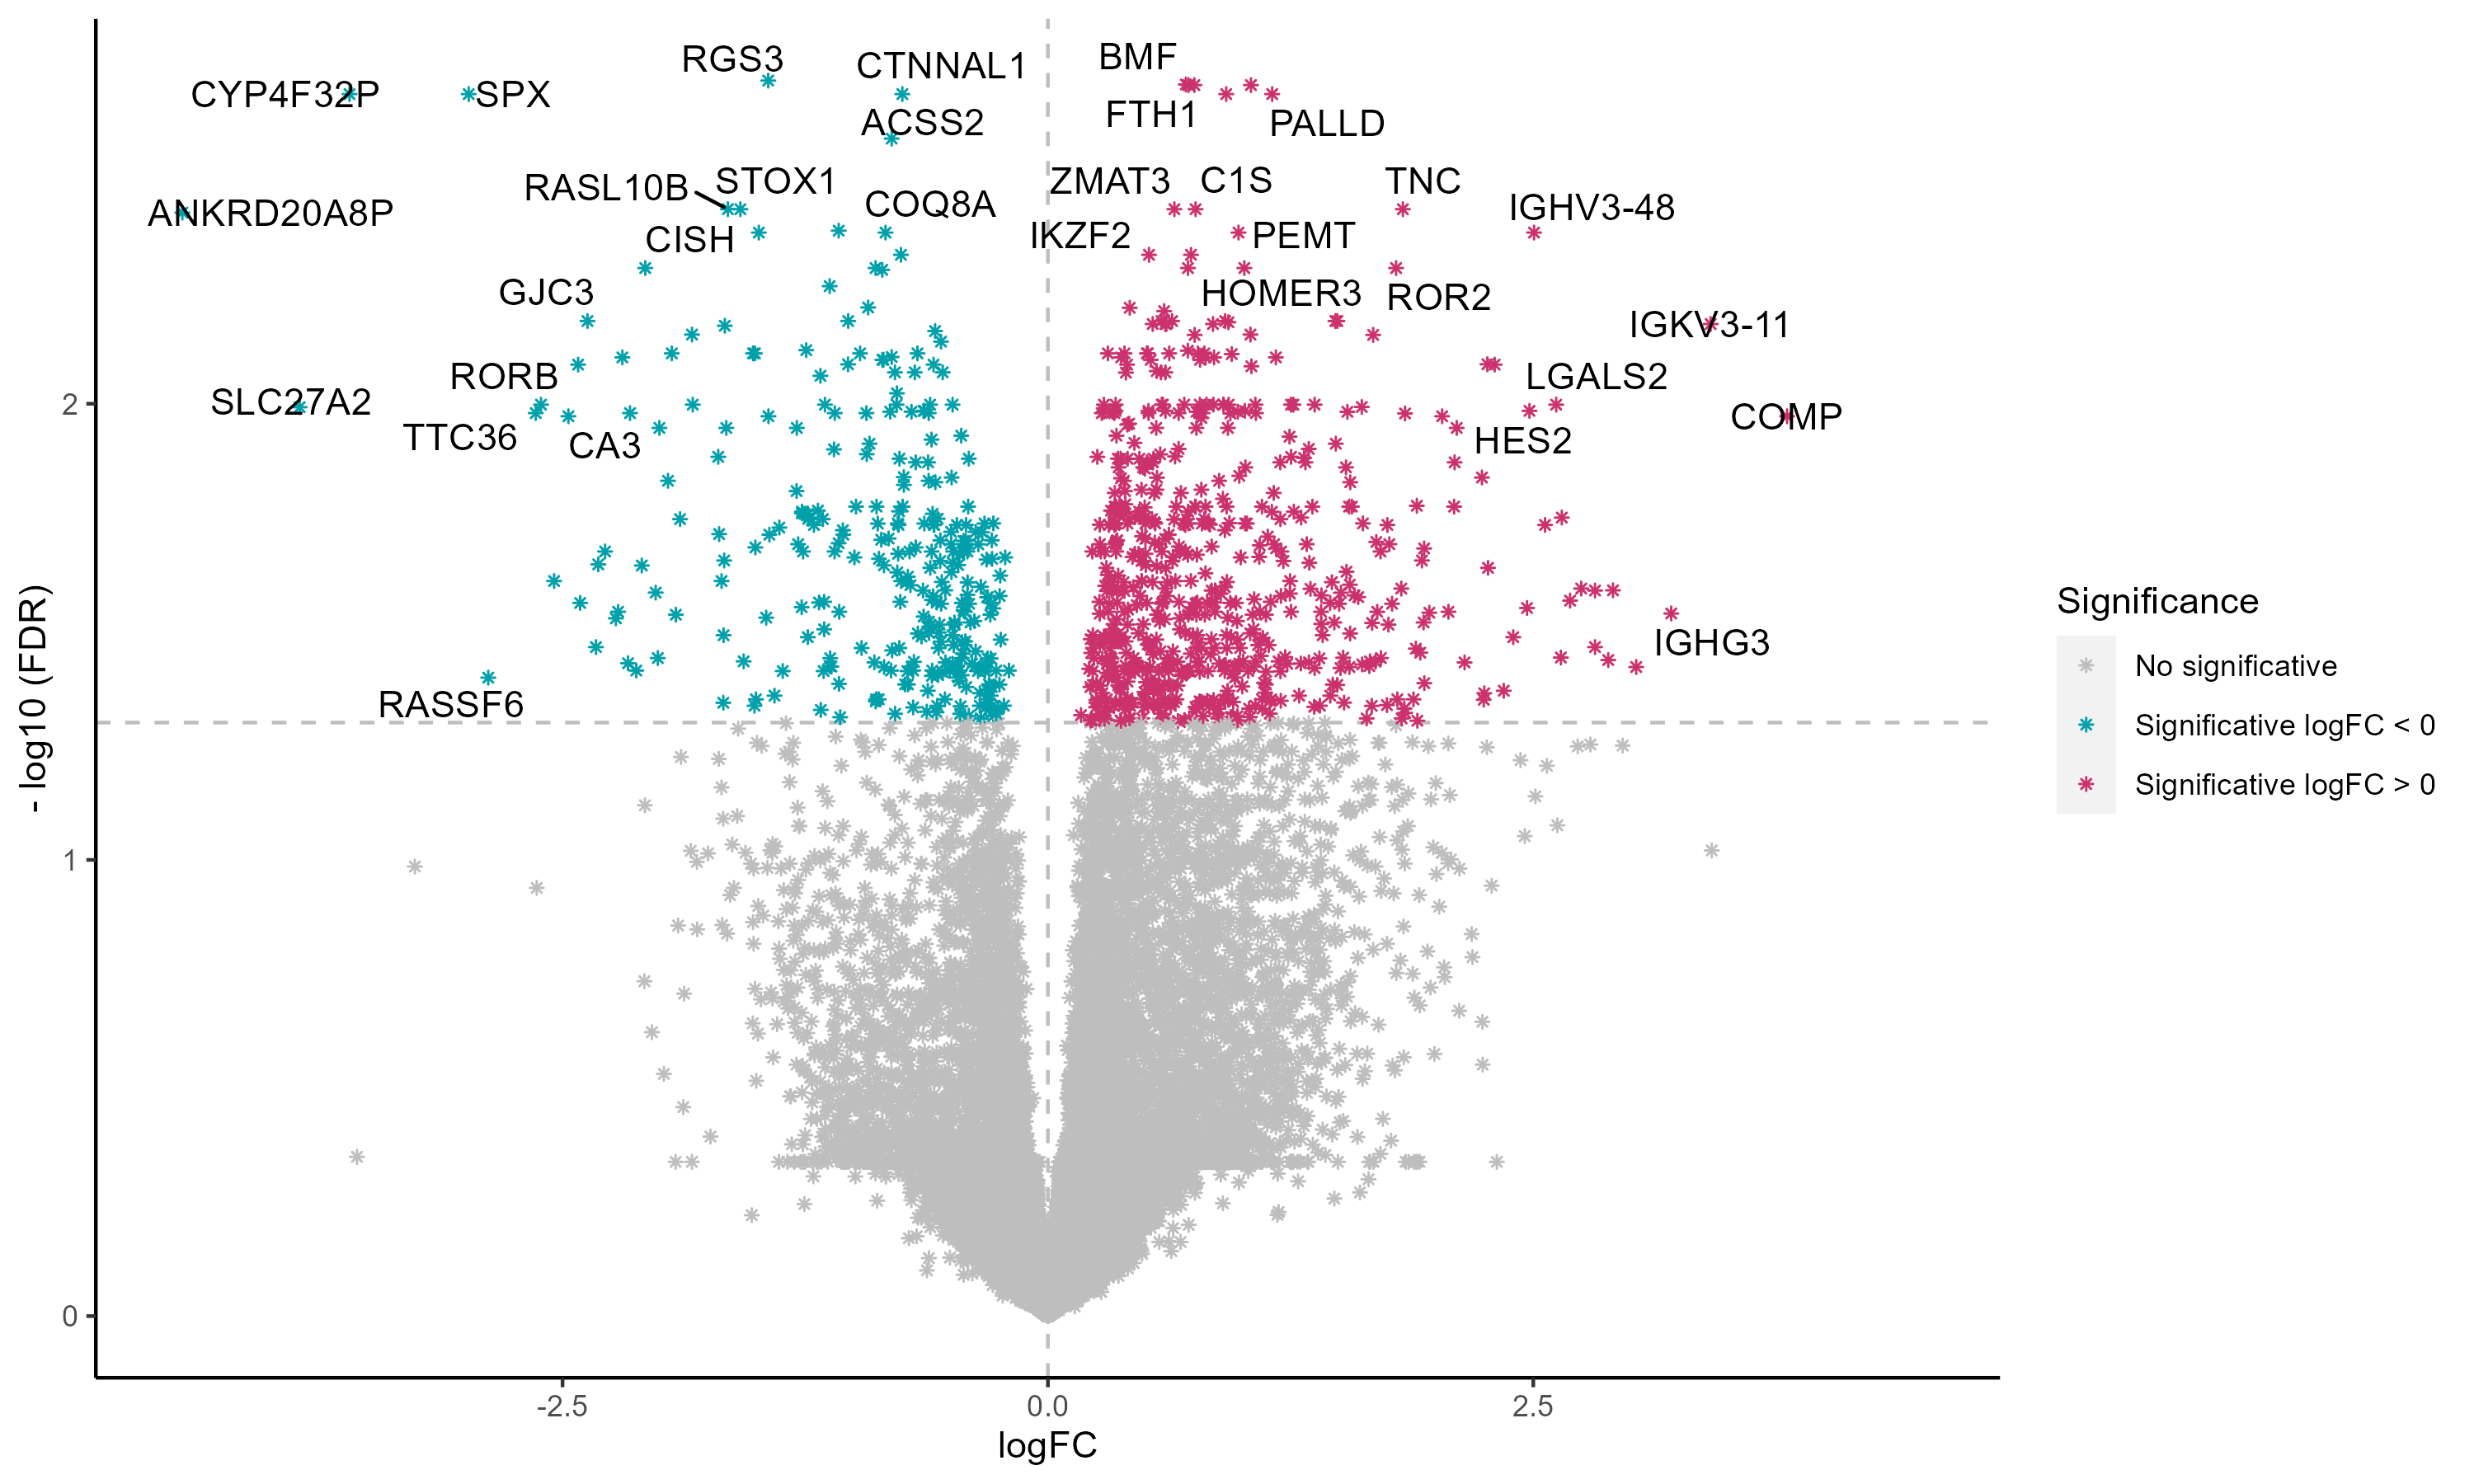
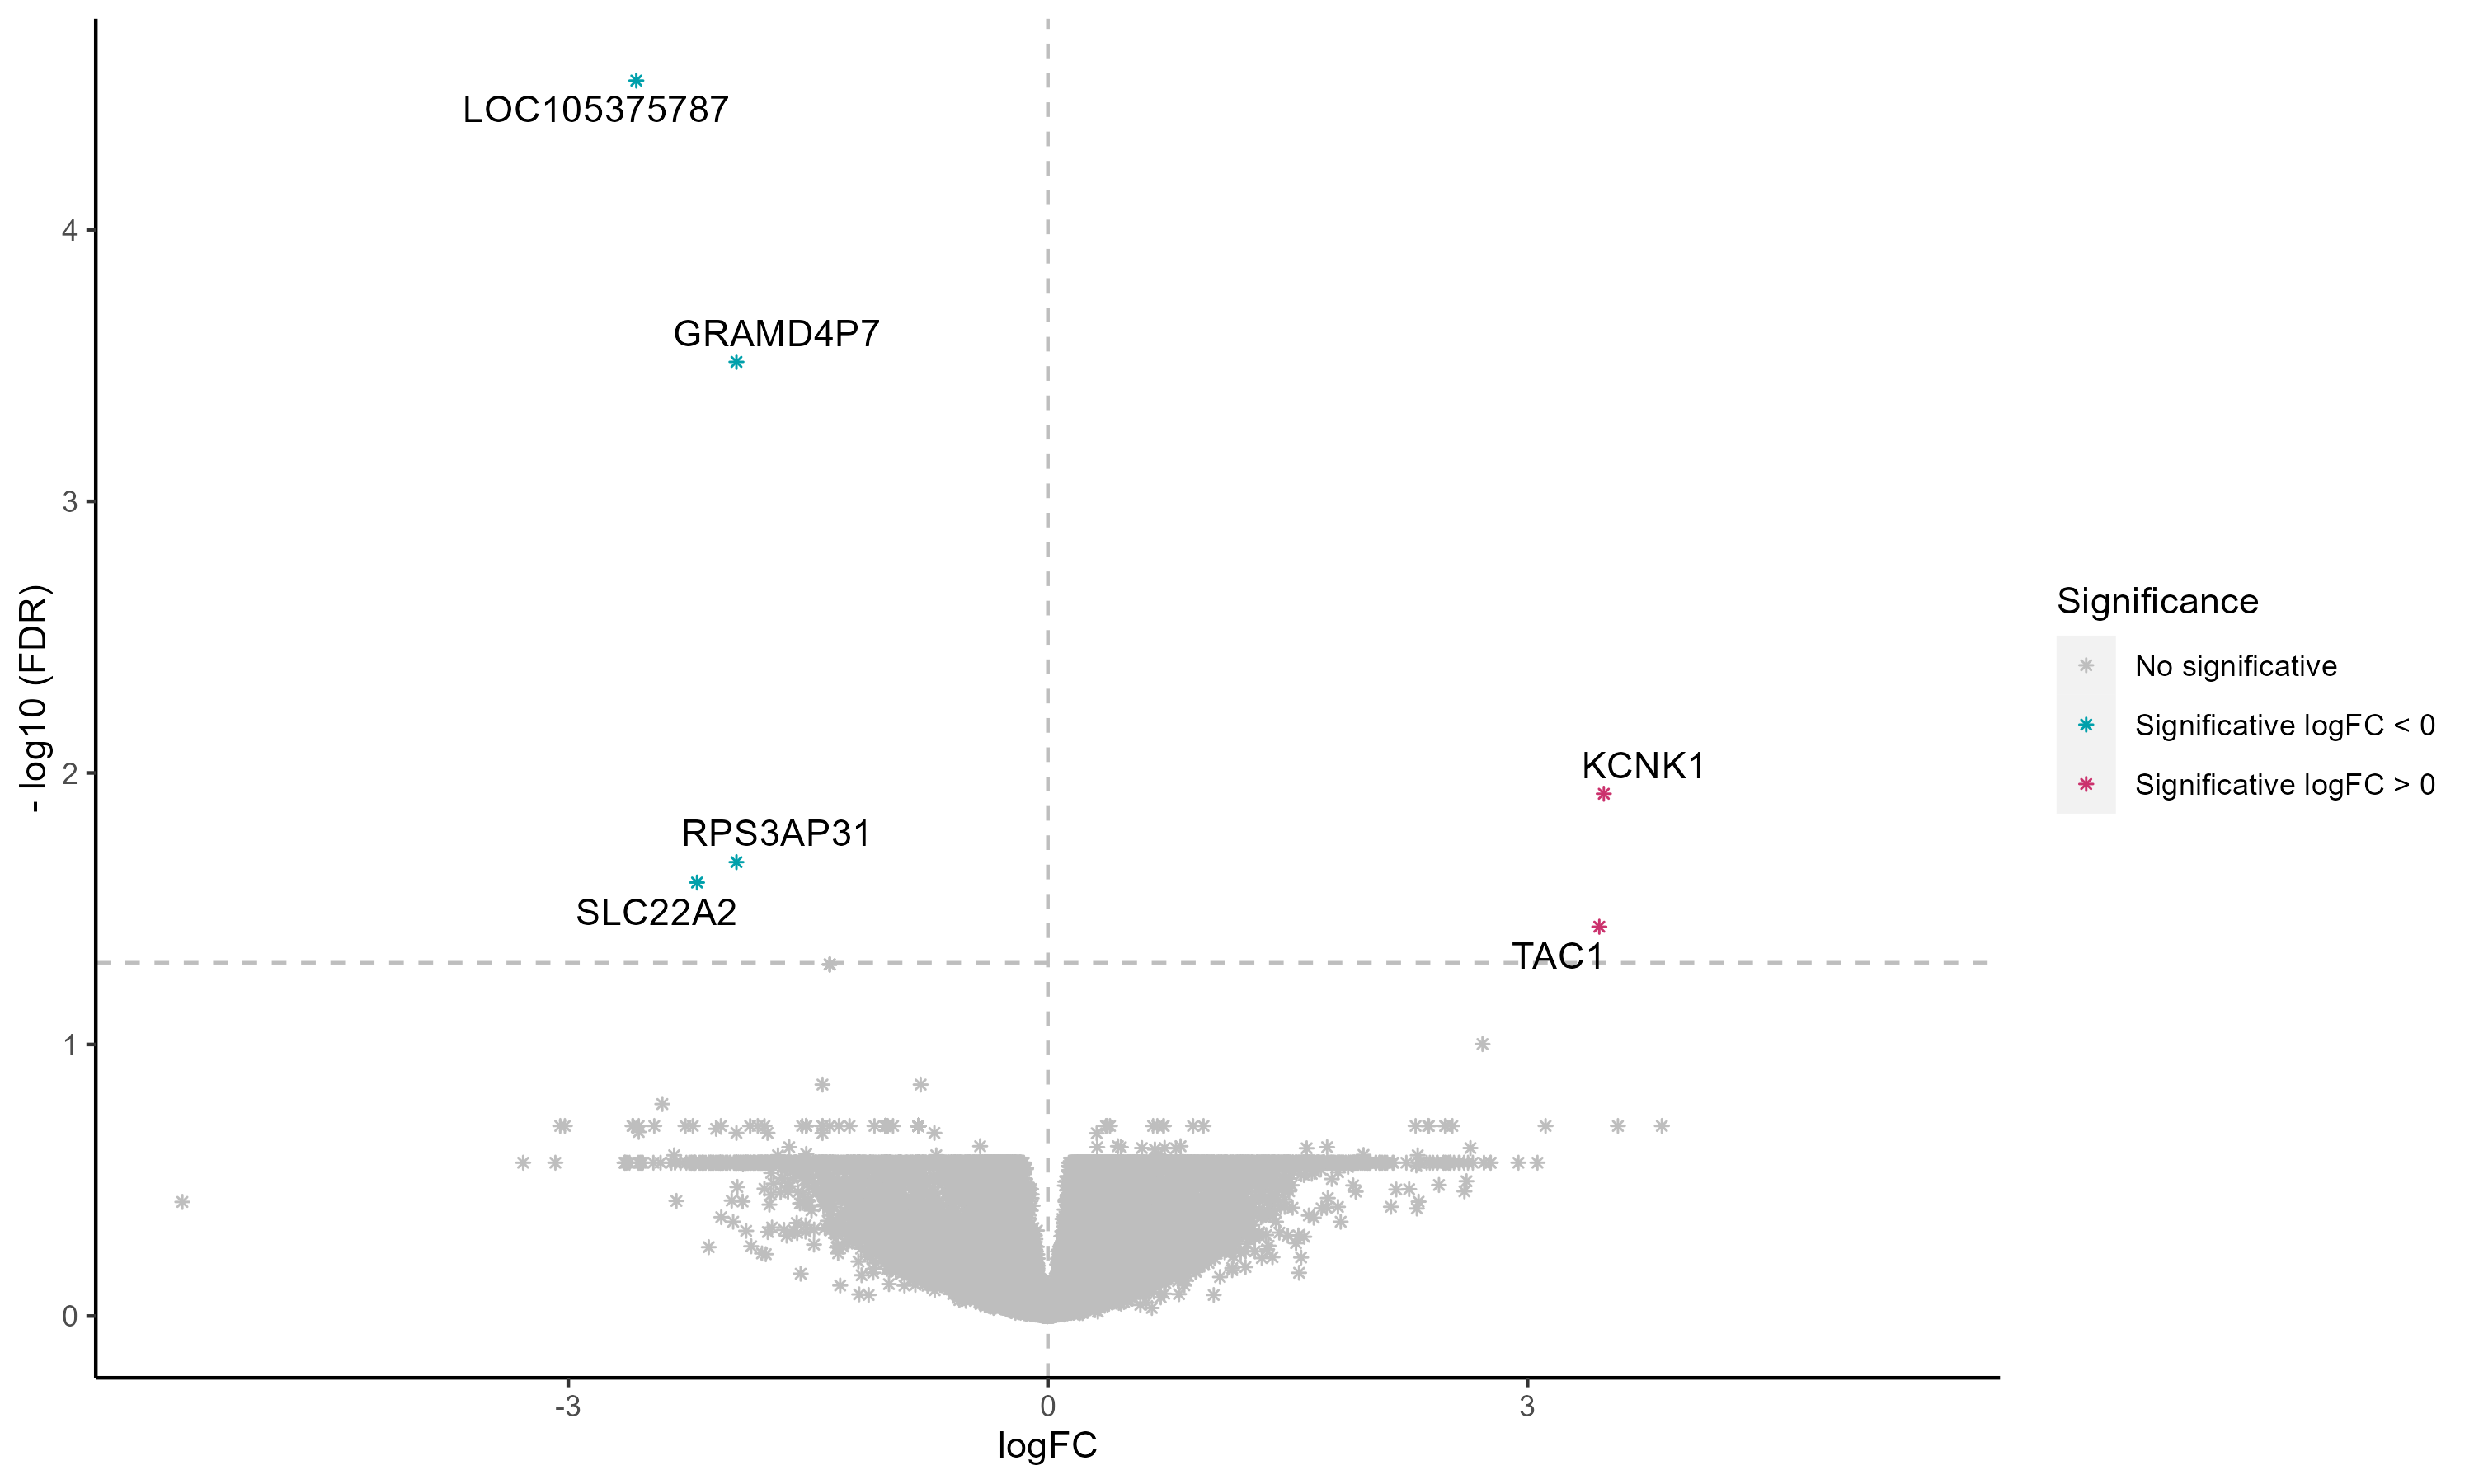
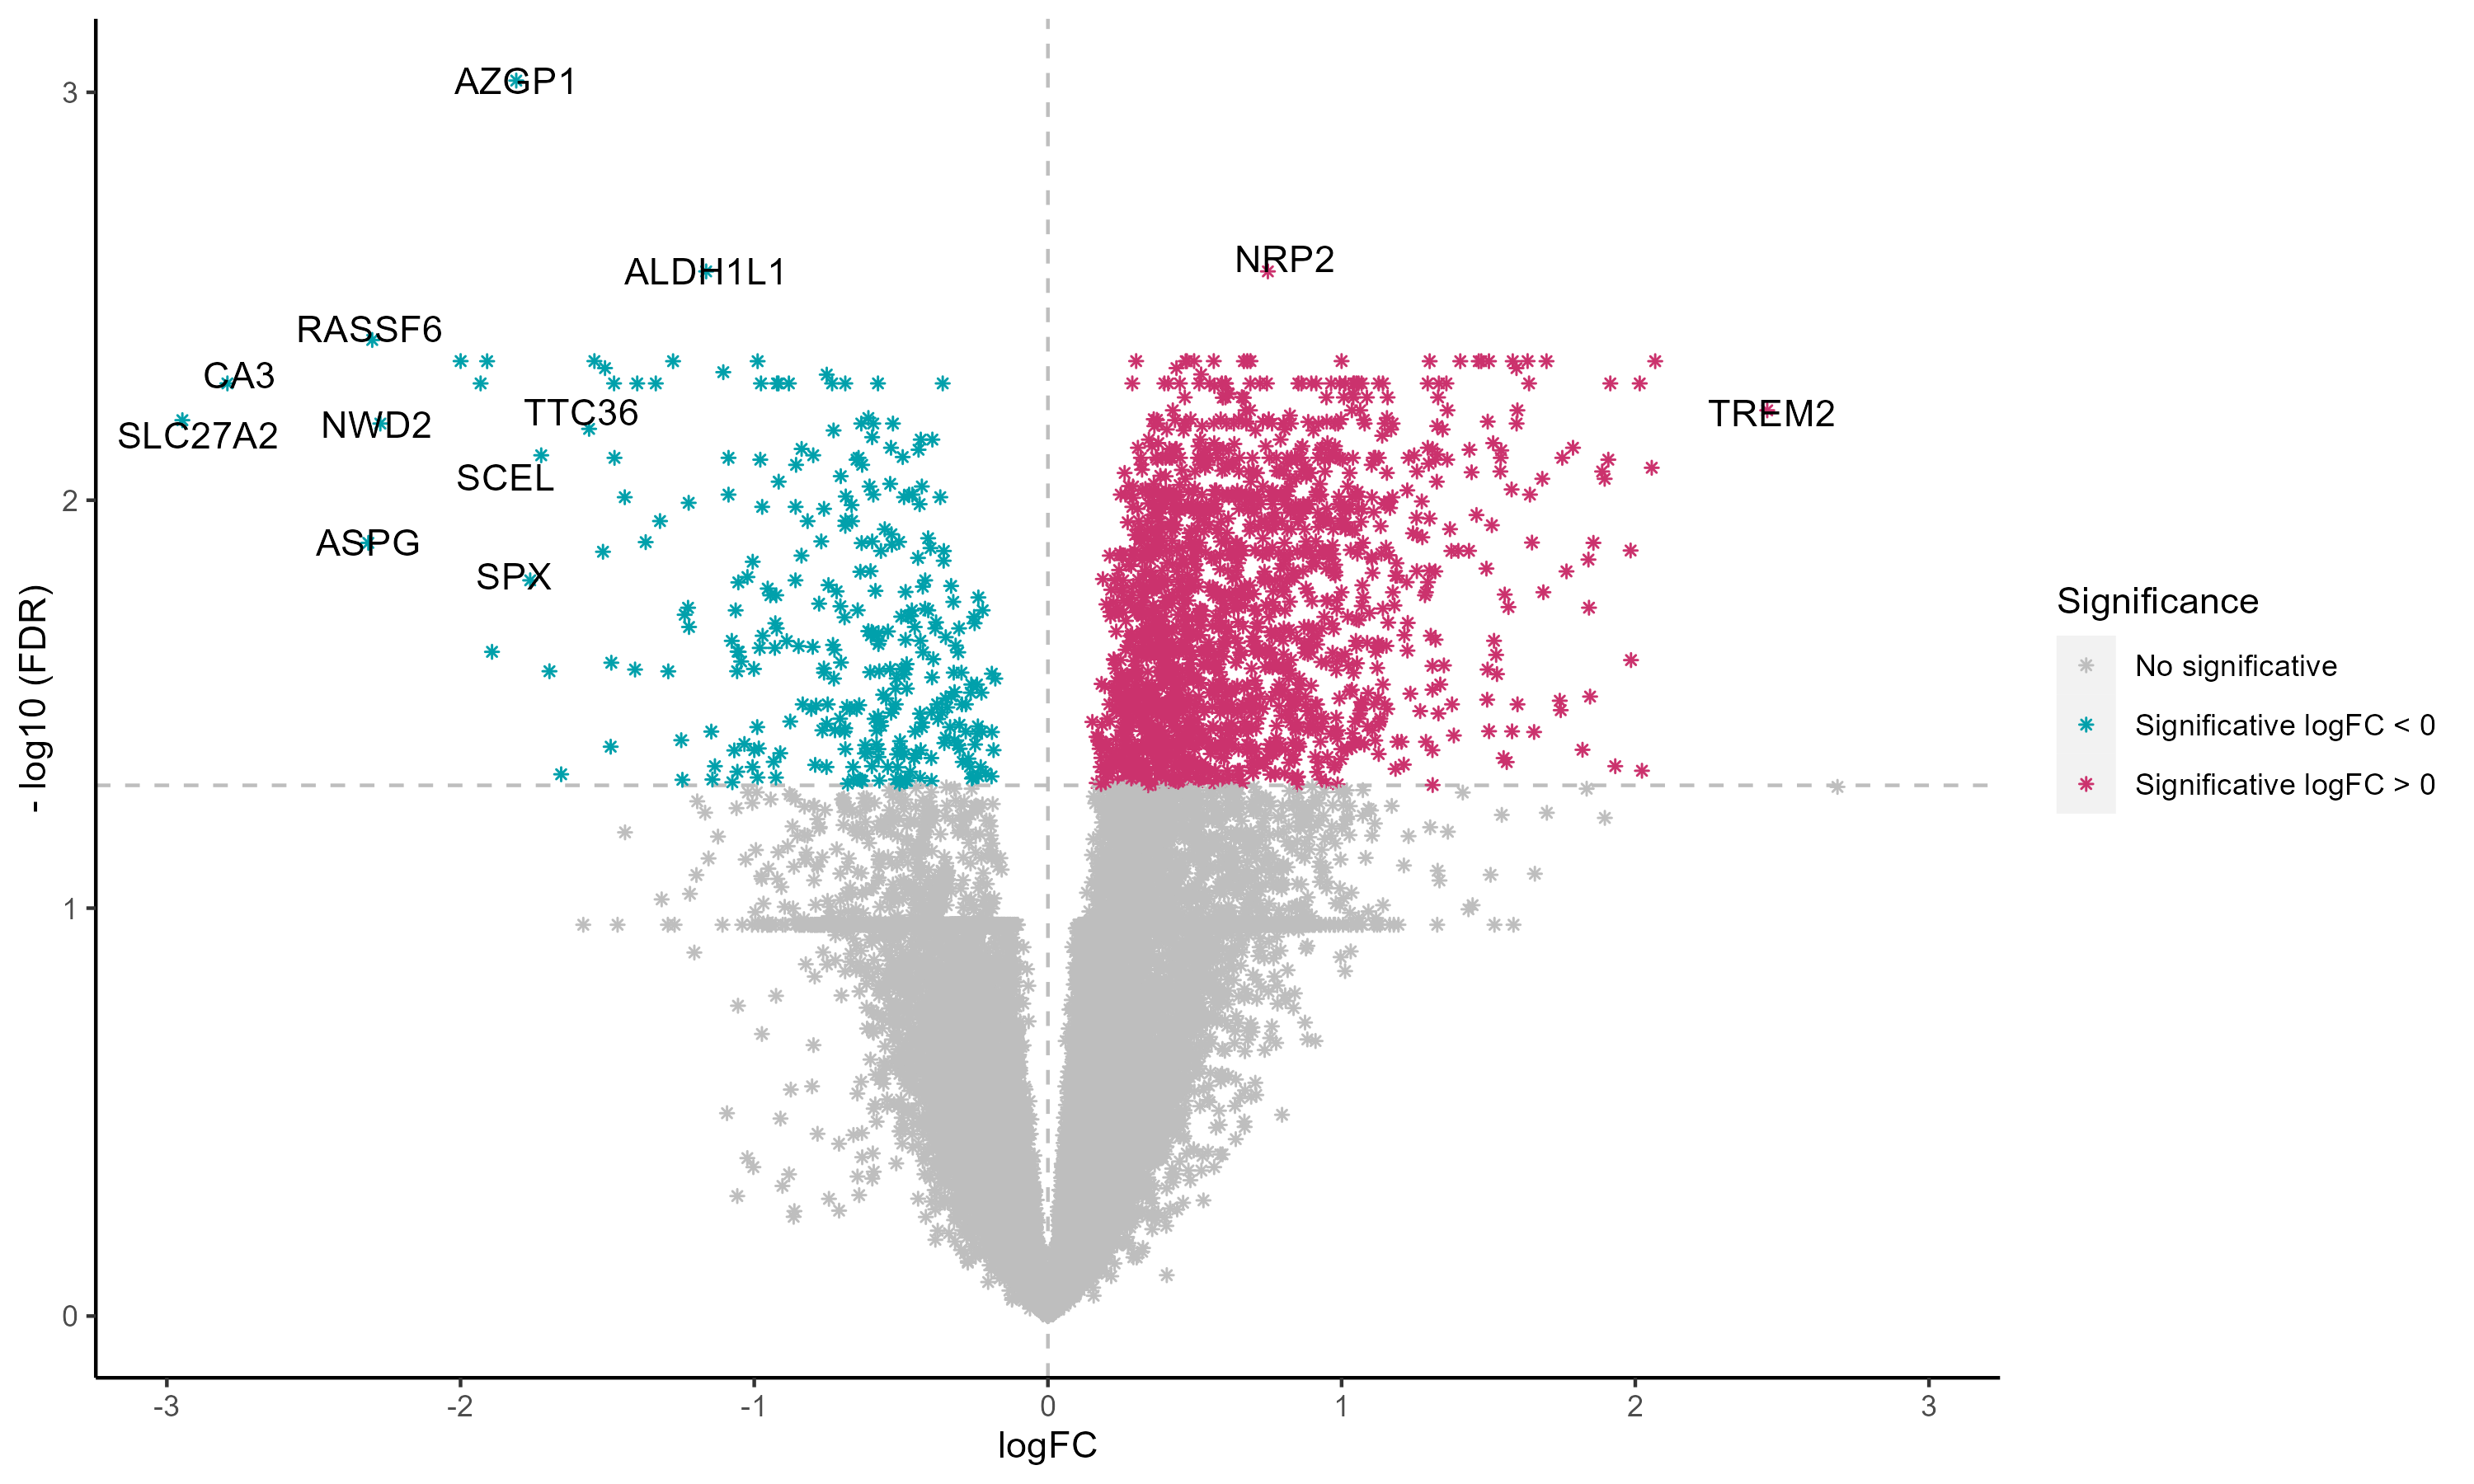
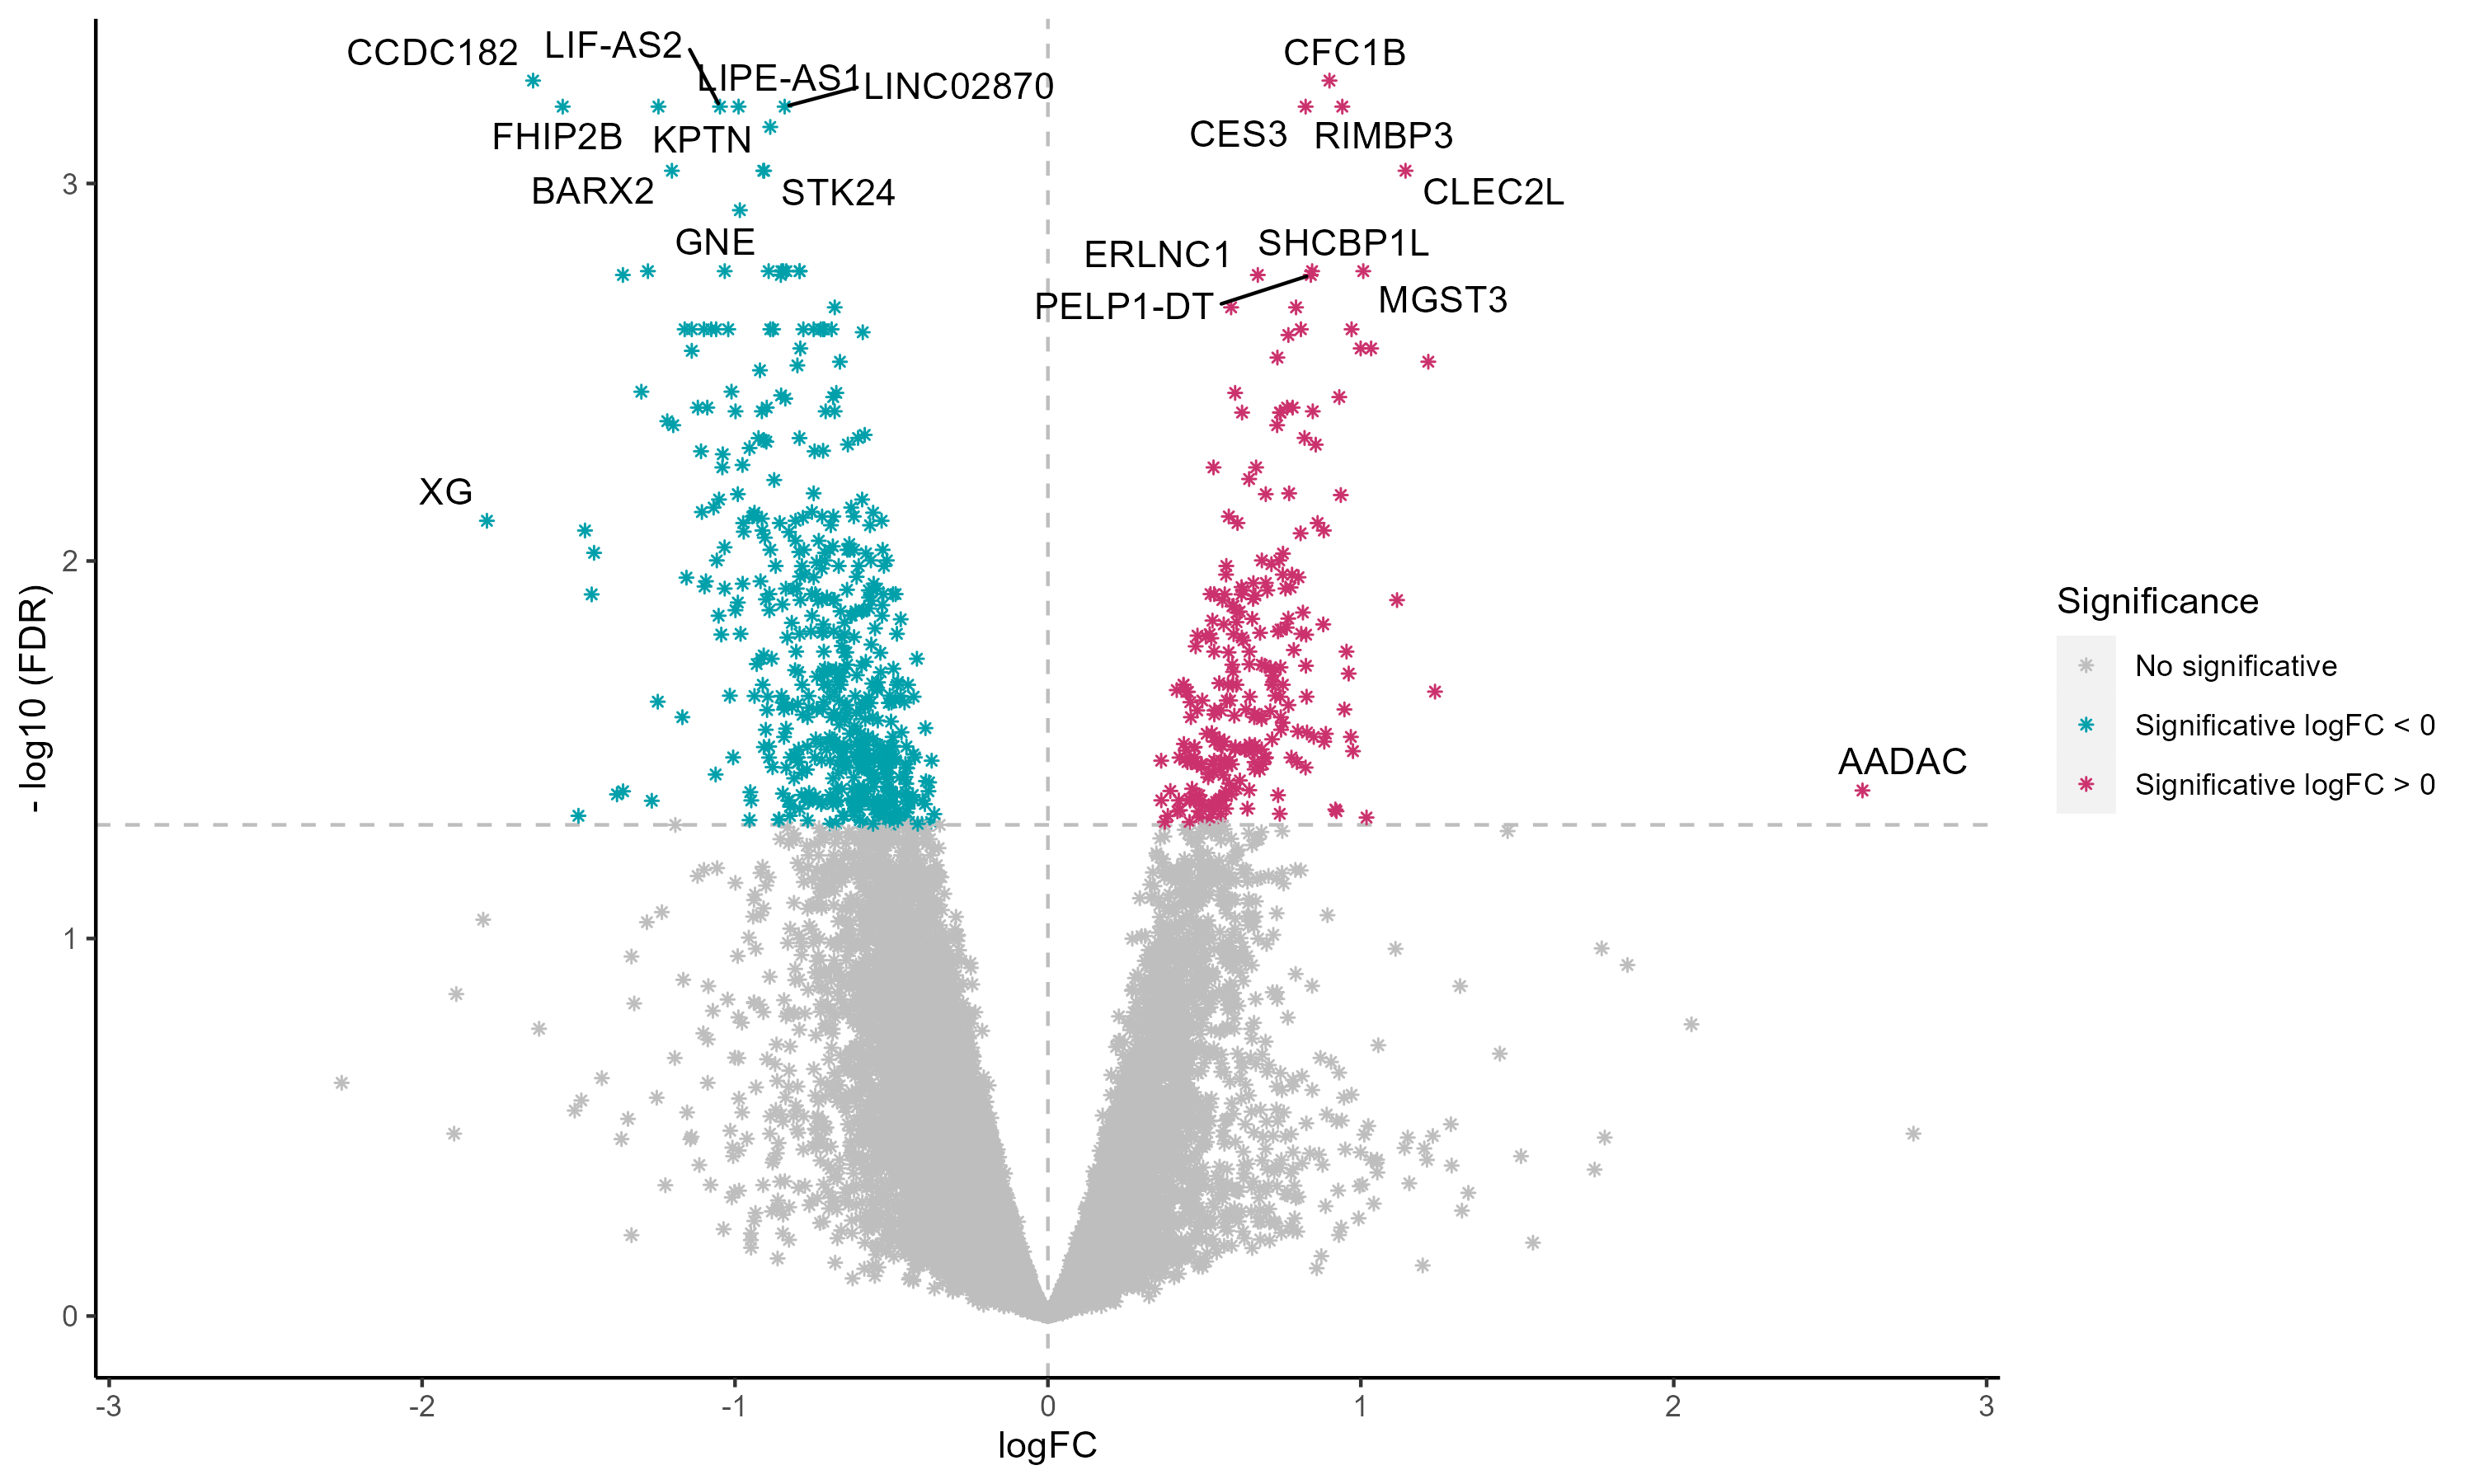
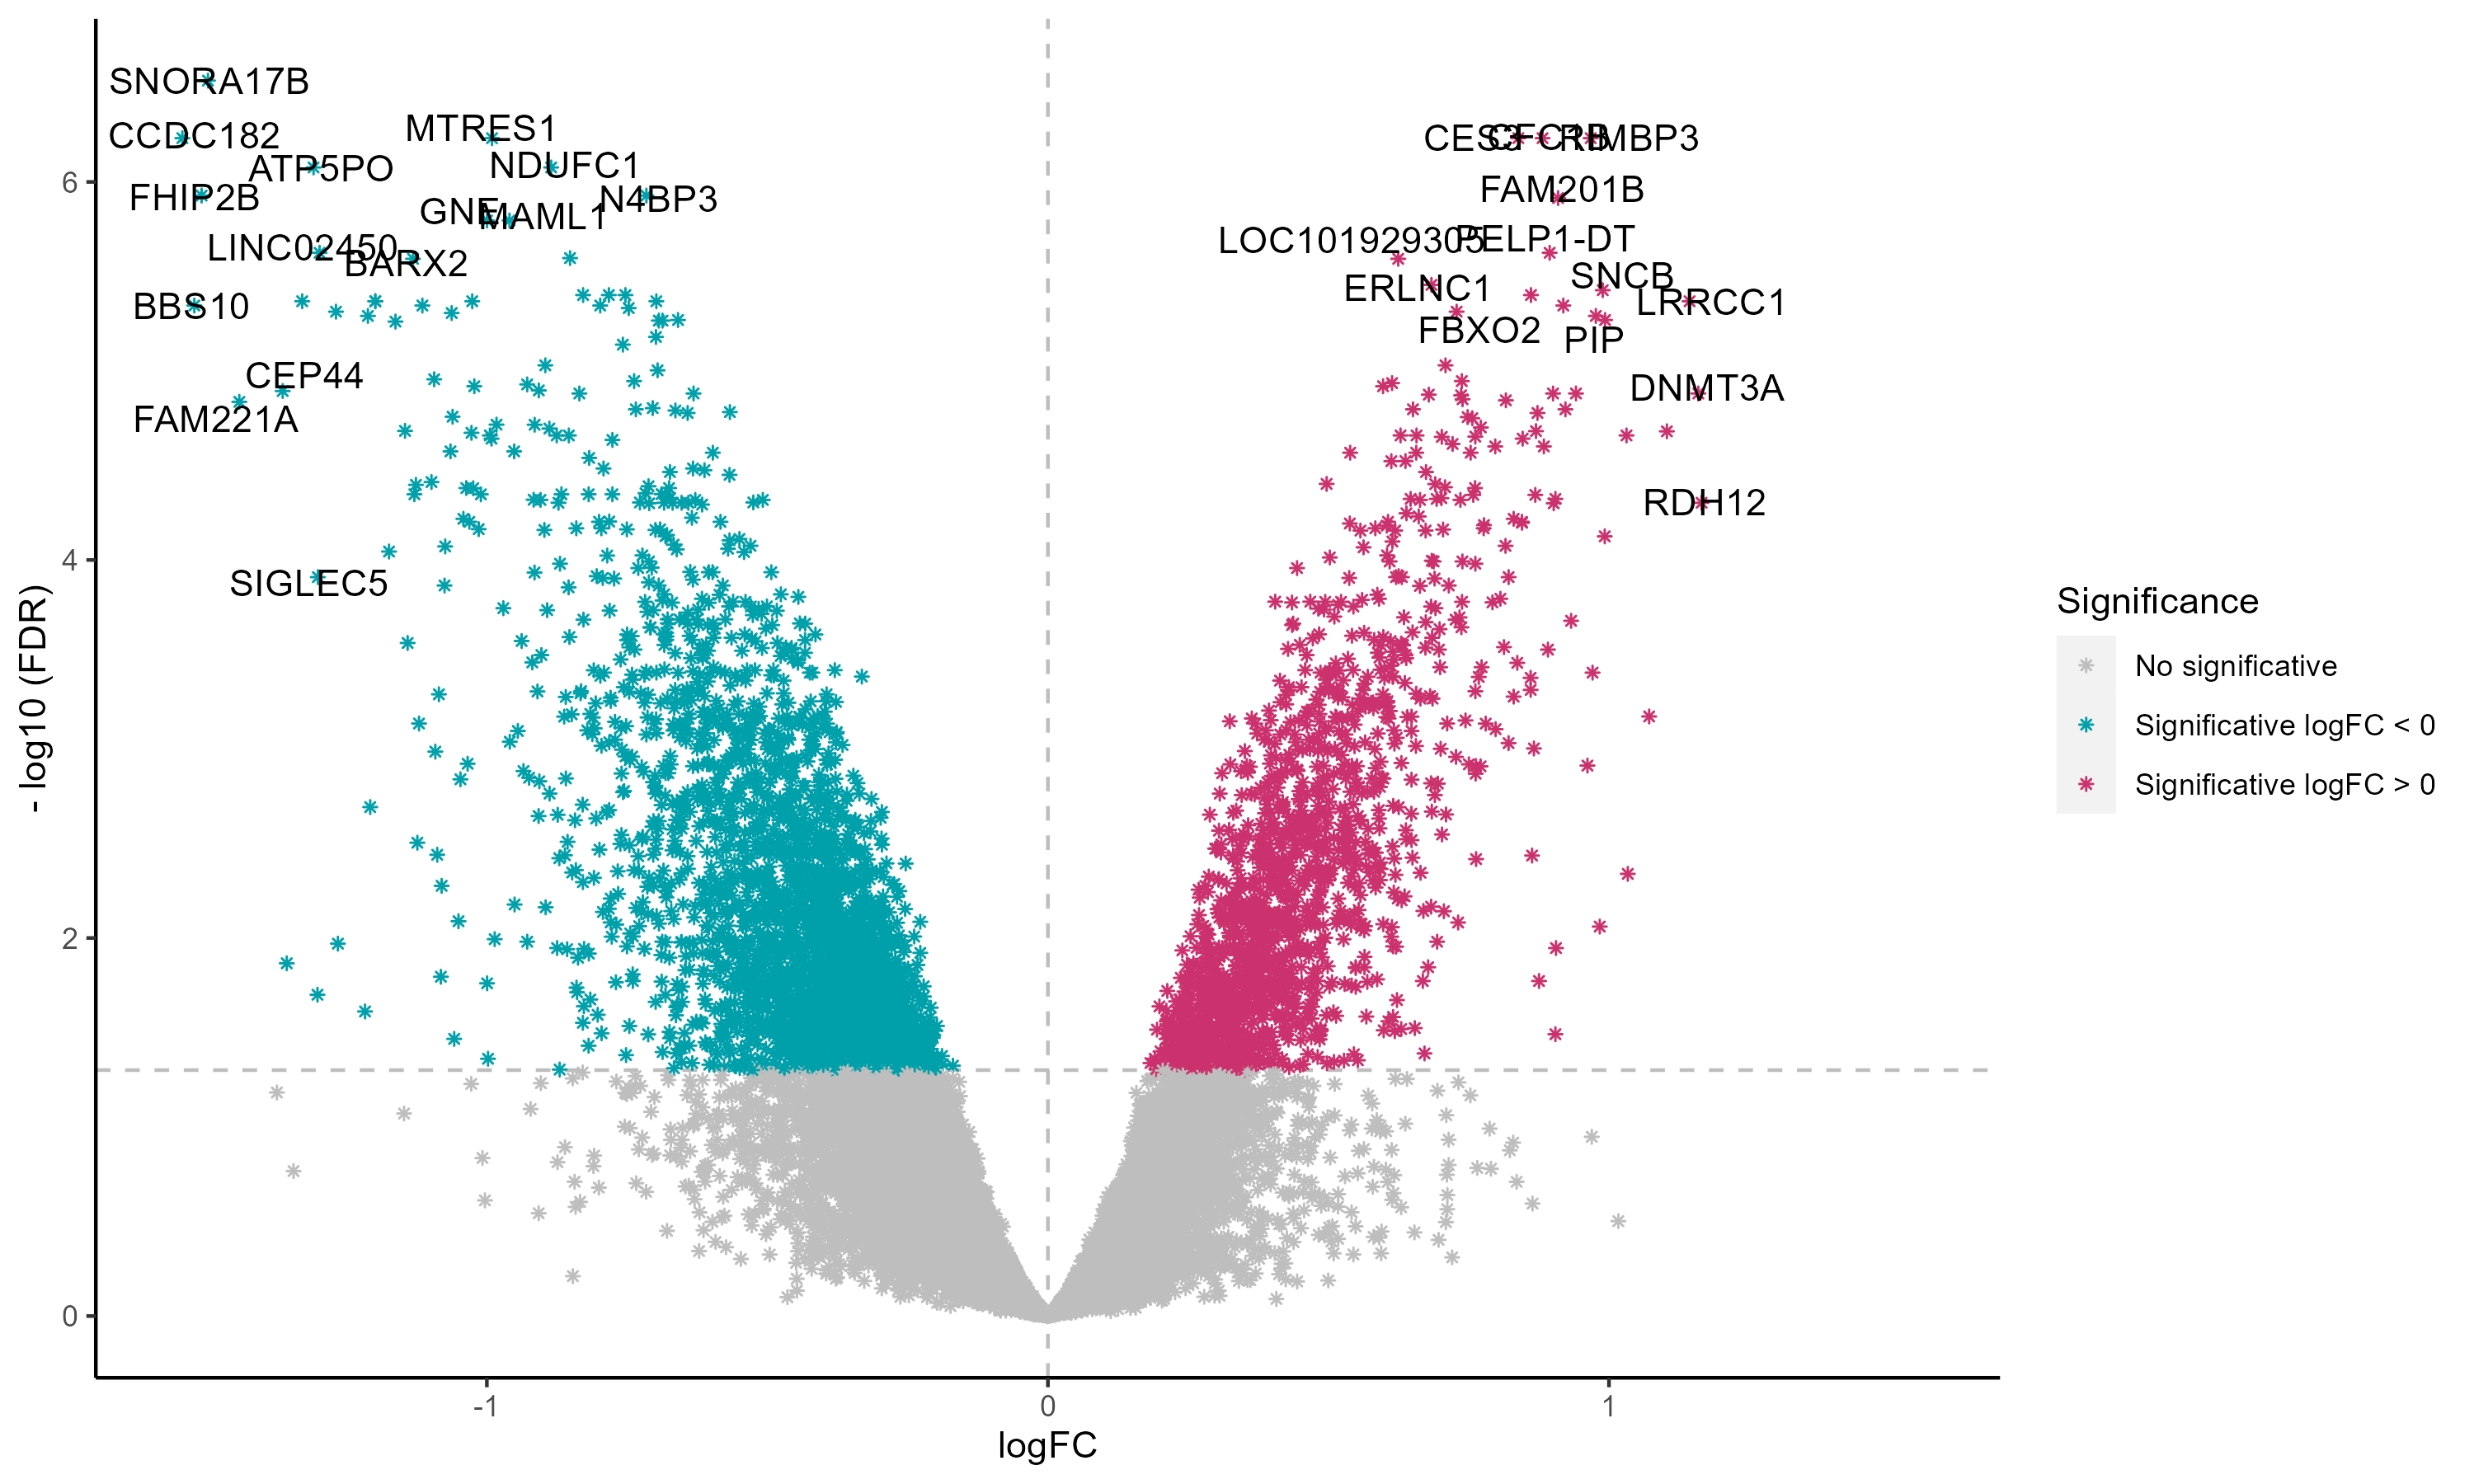
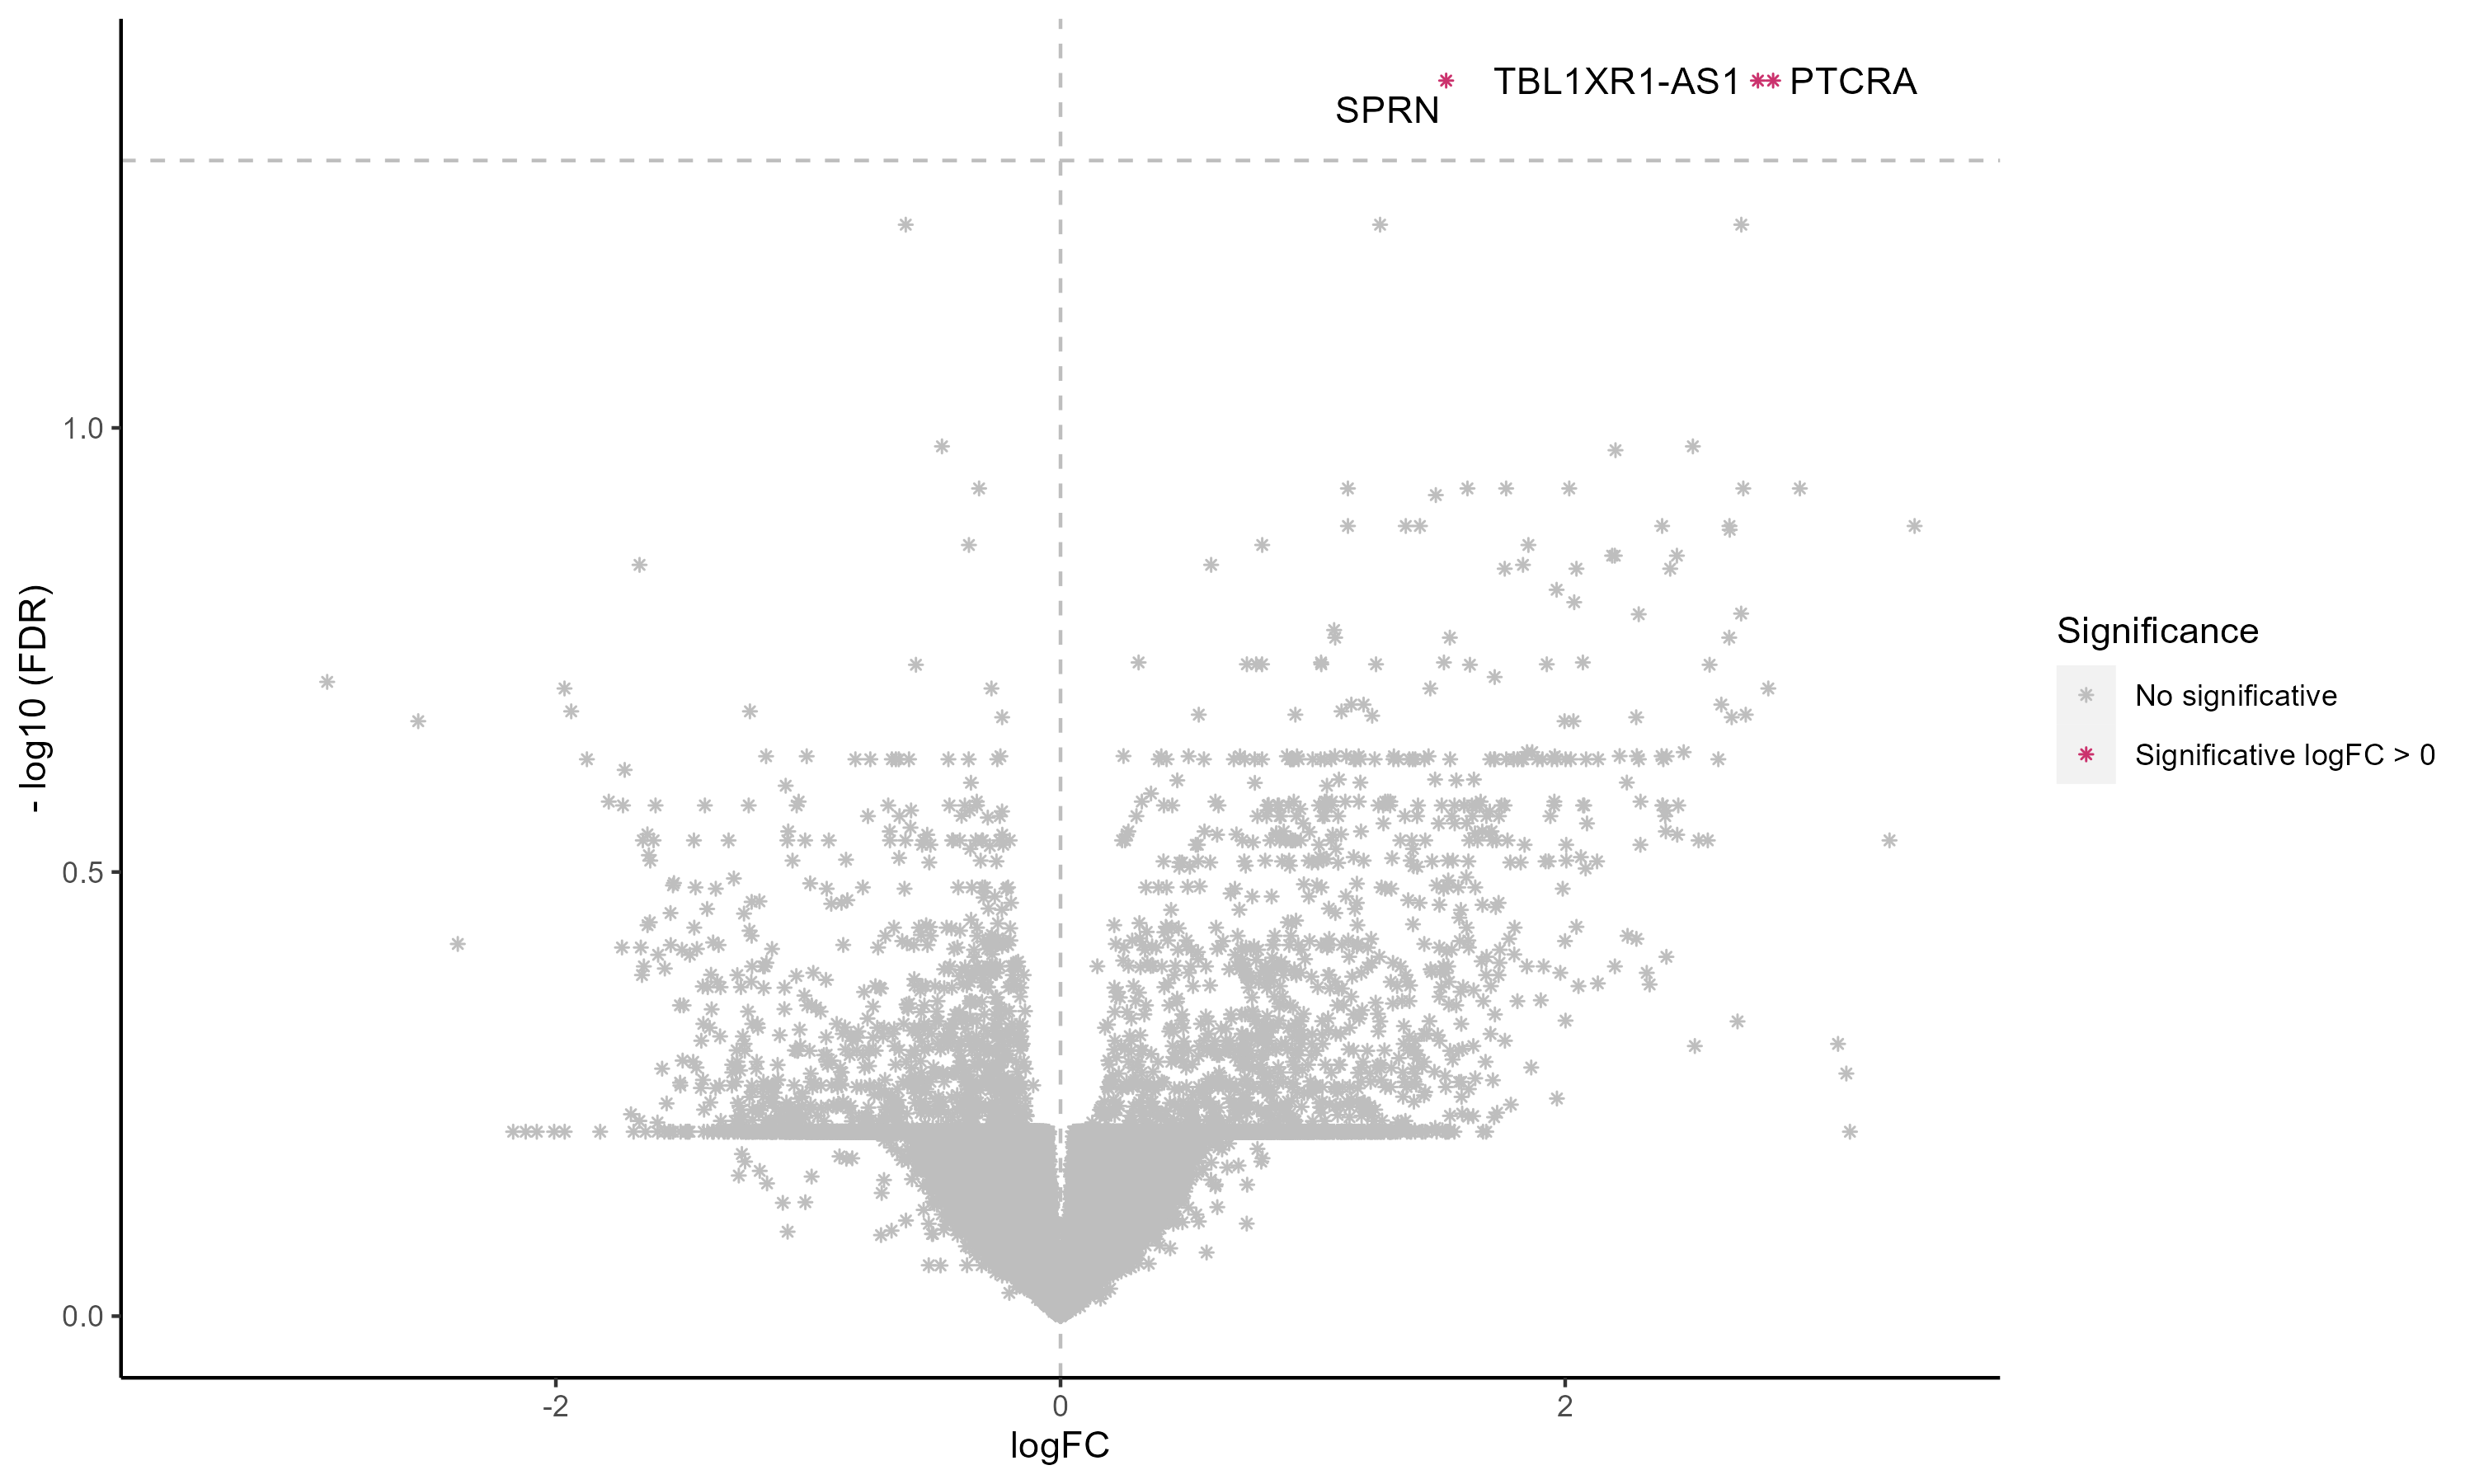
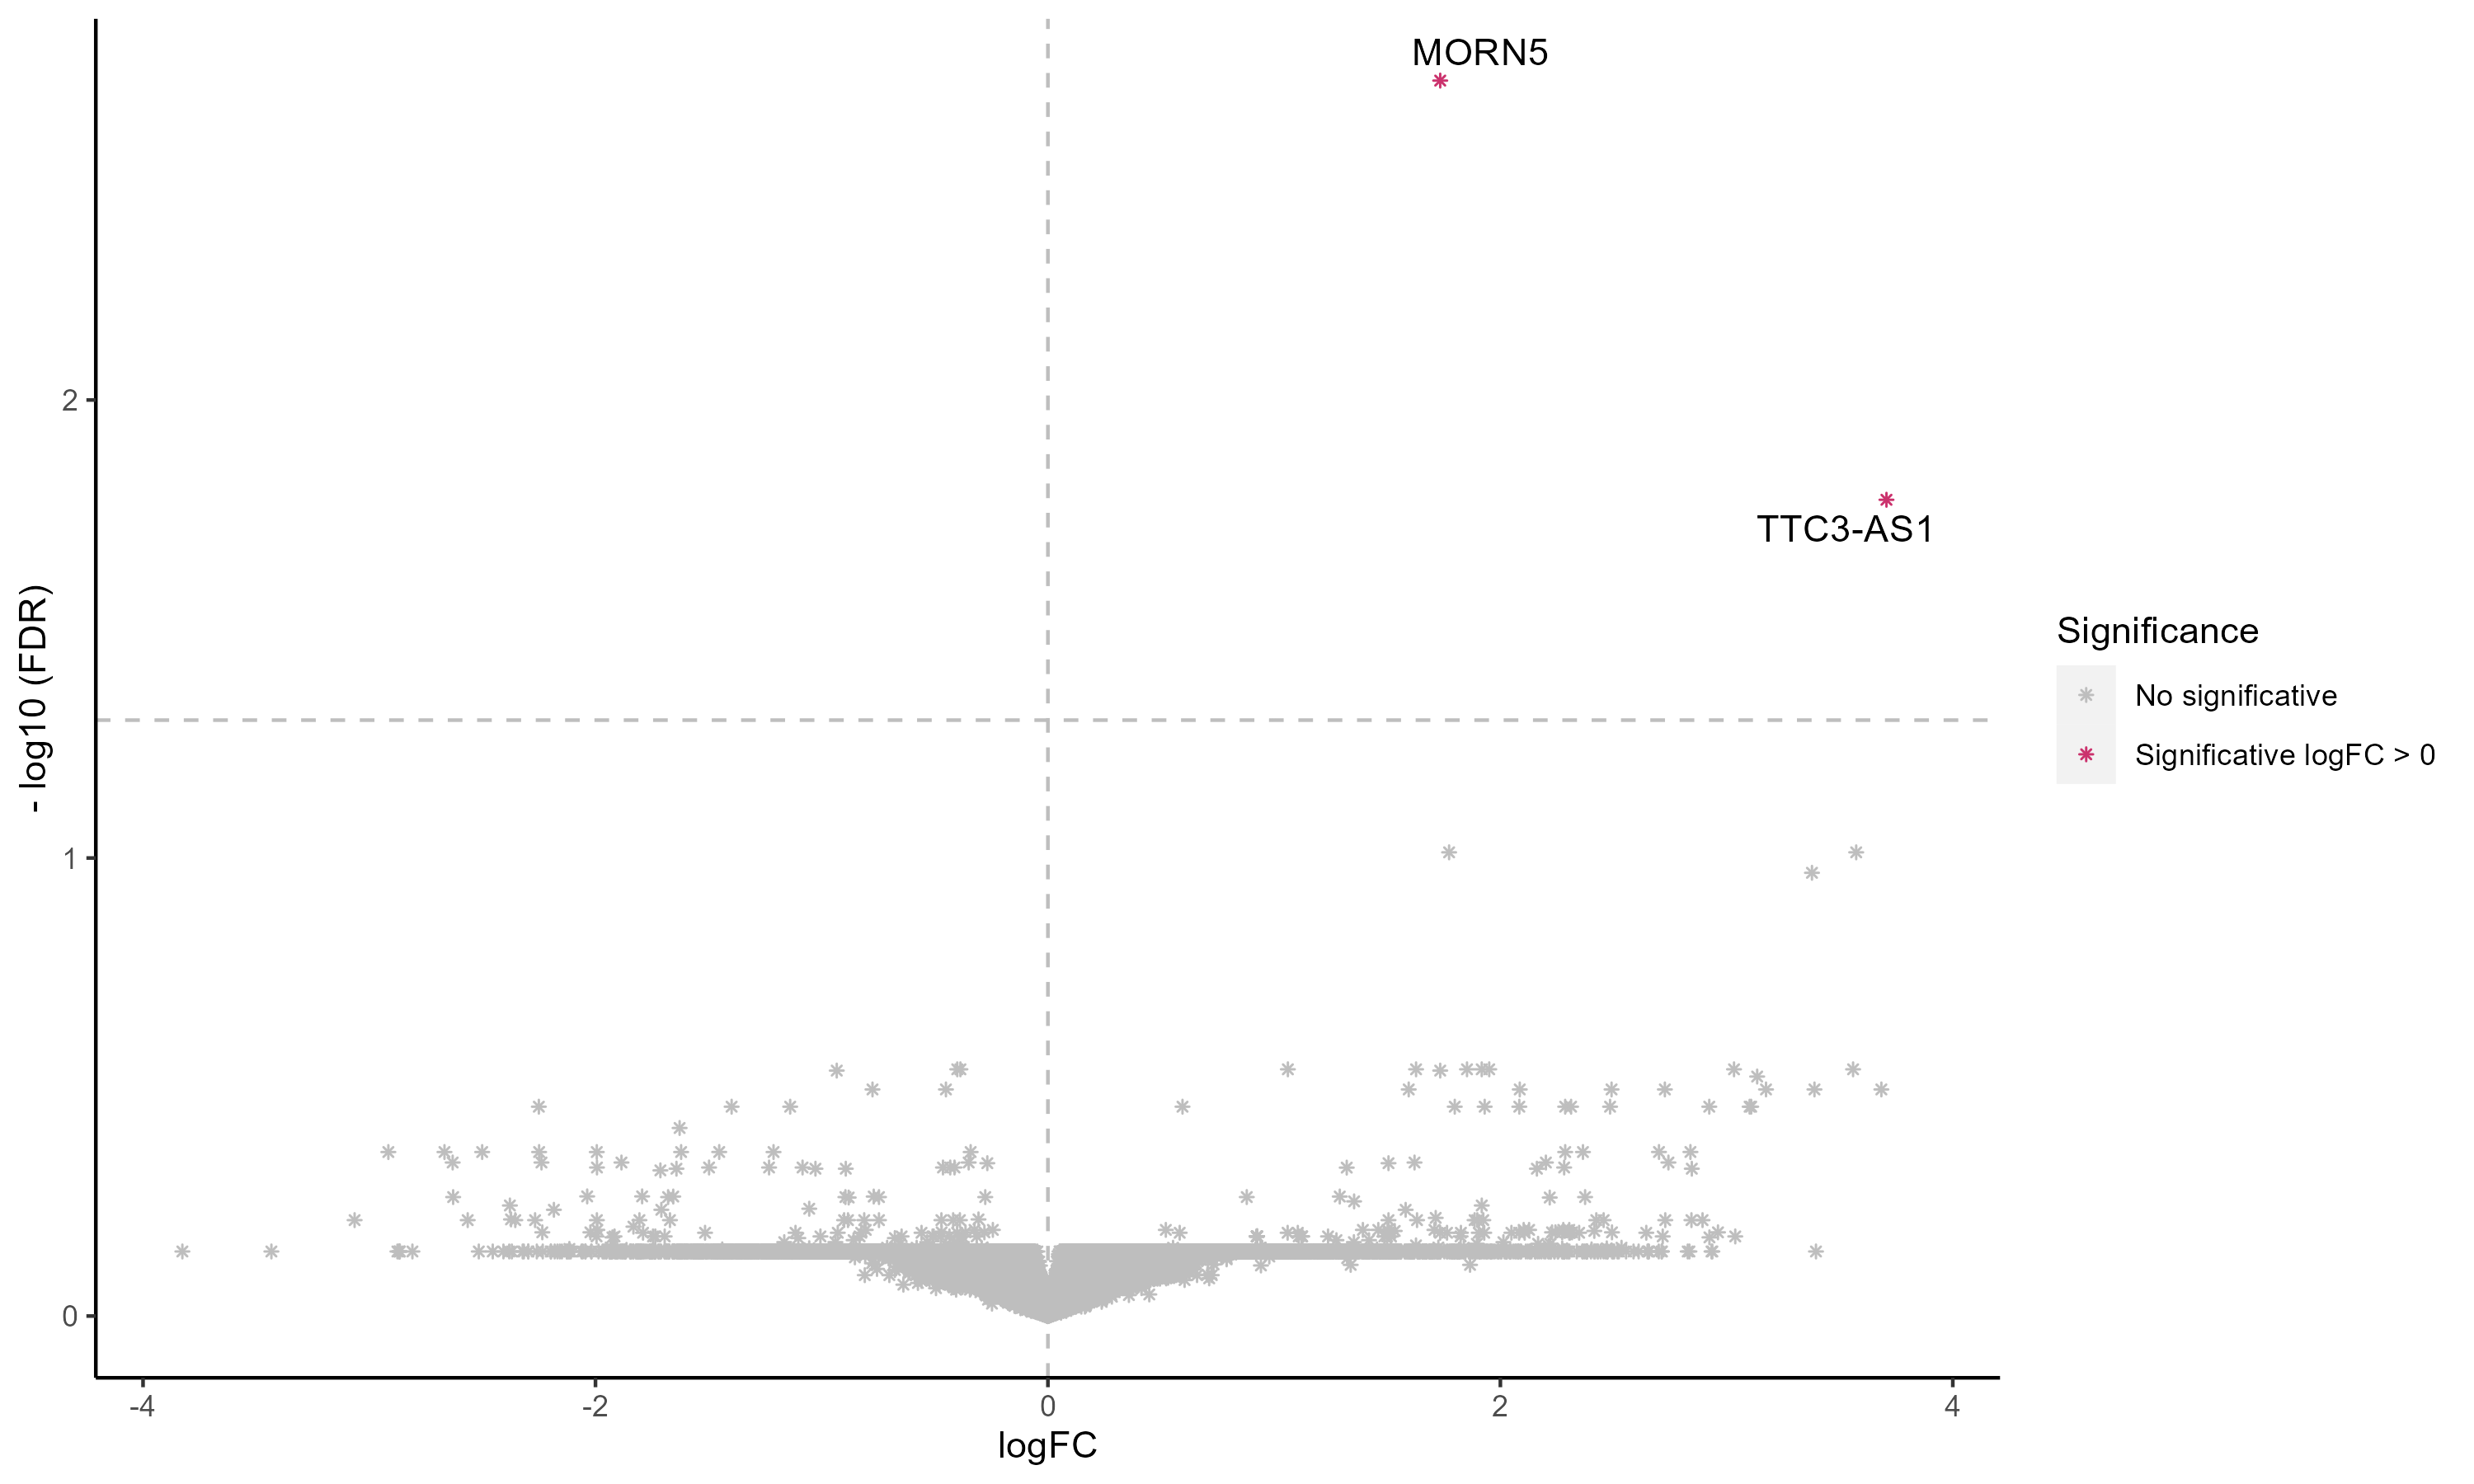
Differential gene expression
For full visualisation and exploitation of the results, please visit E_MEXP_1425.
-(Ob.F-C.F).png)
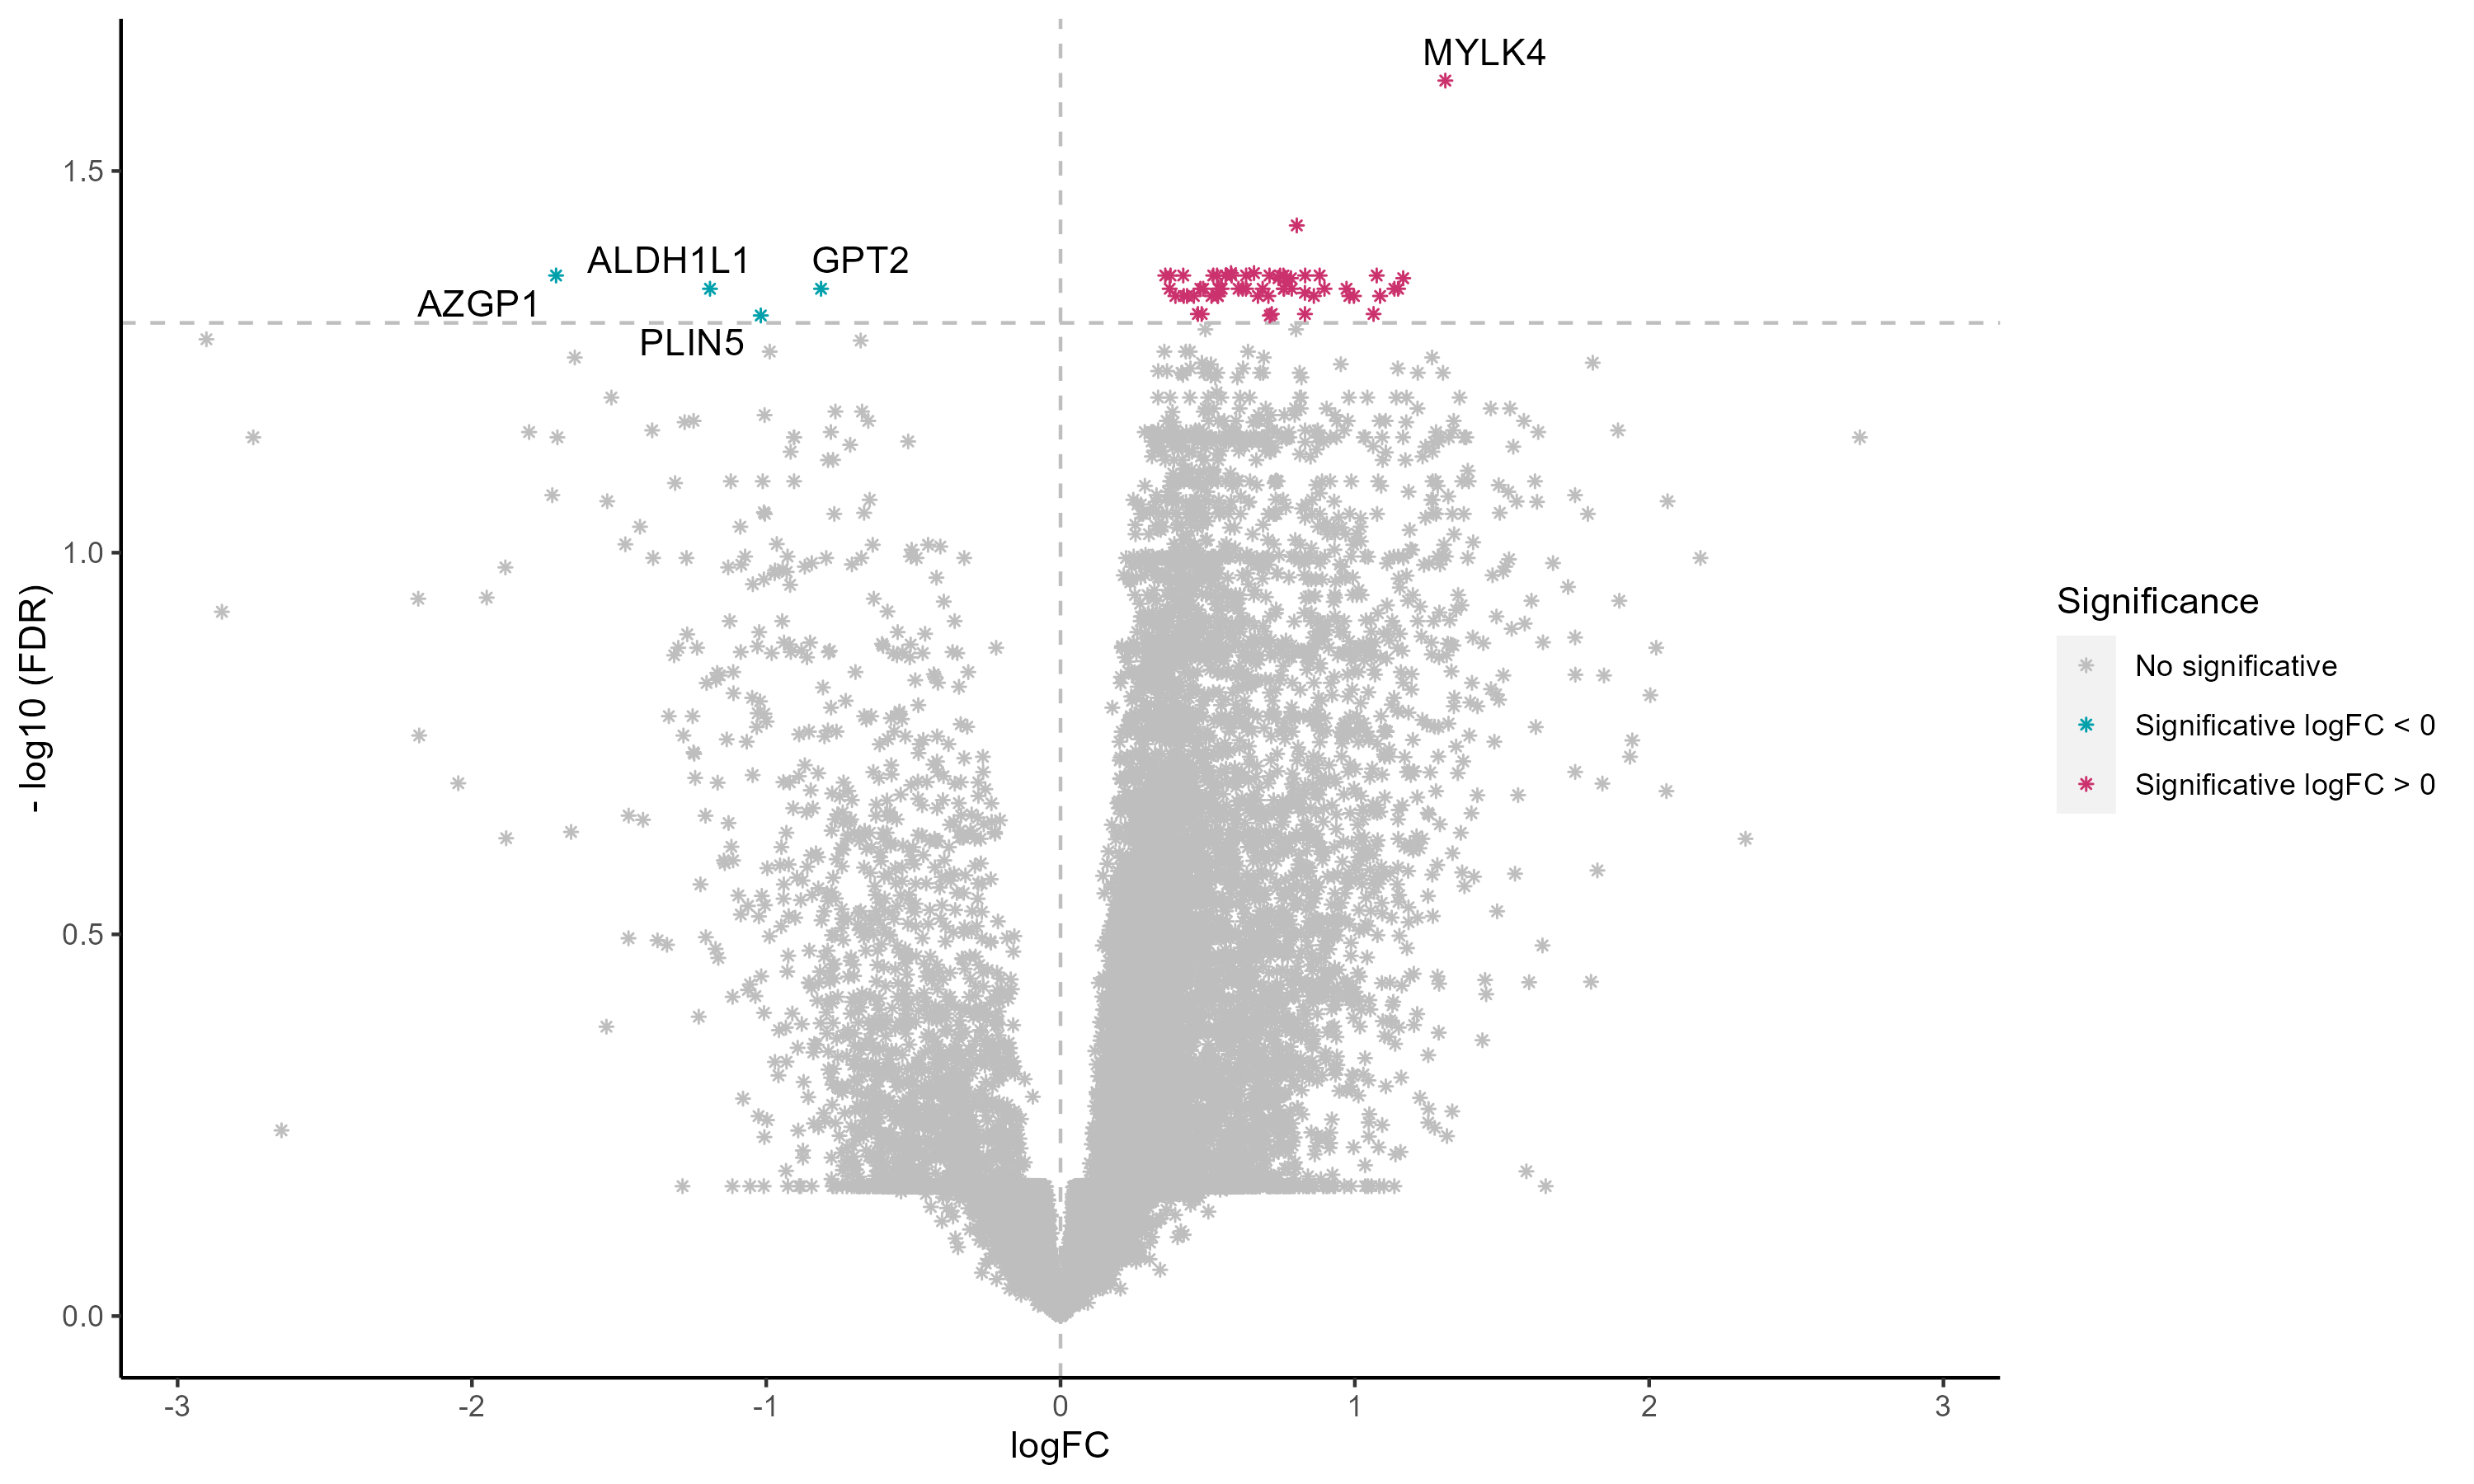
For full visualisation and exploitation of the results, please visit GSE2508.

-(Ob.F-C.F).png)
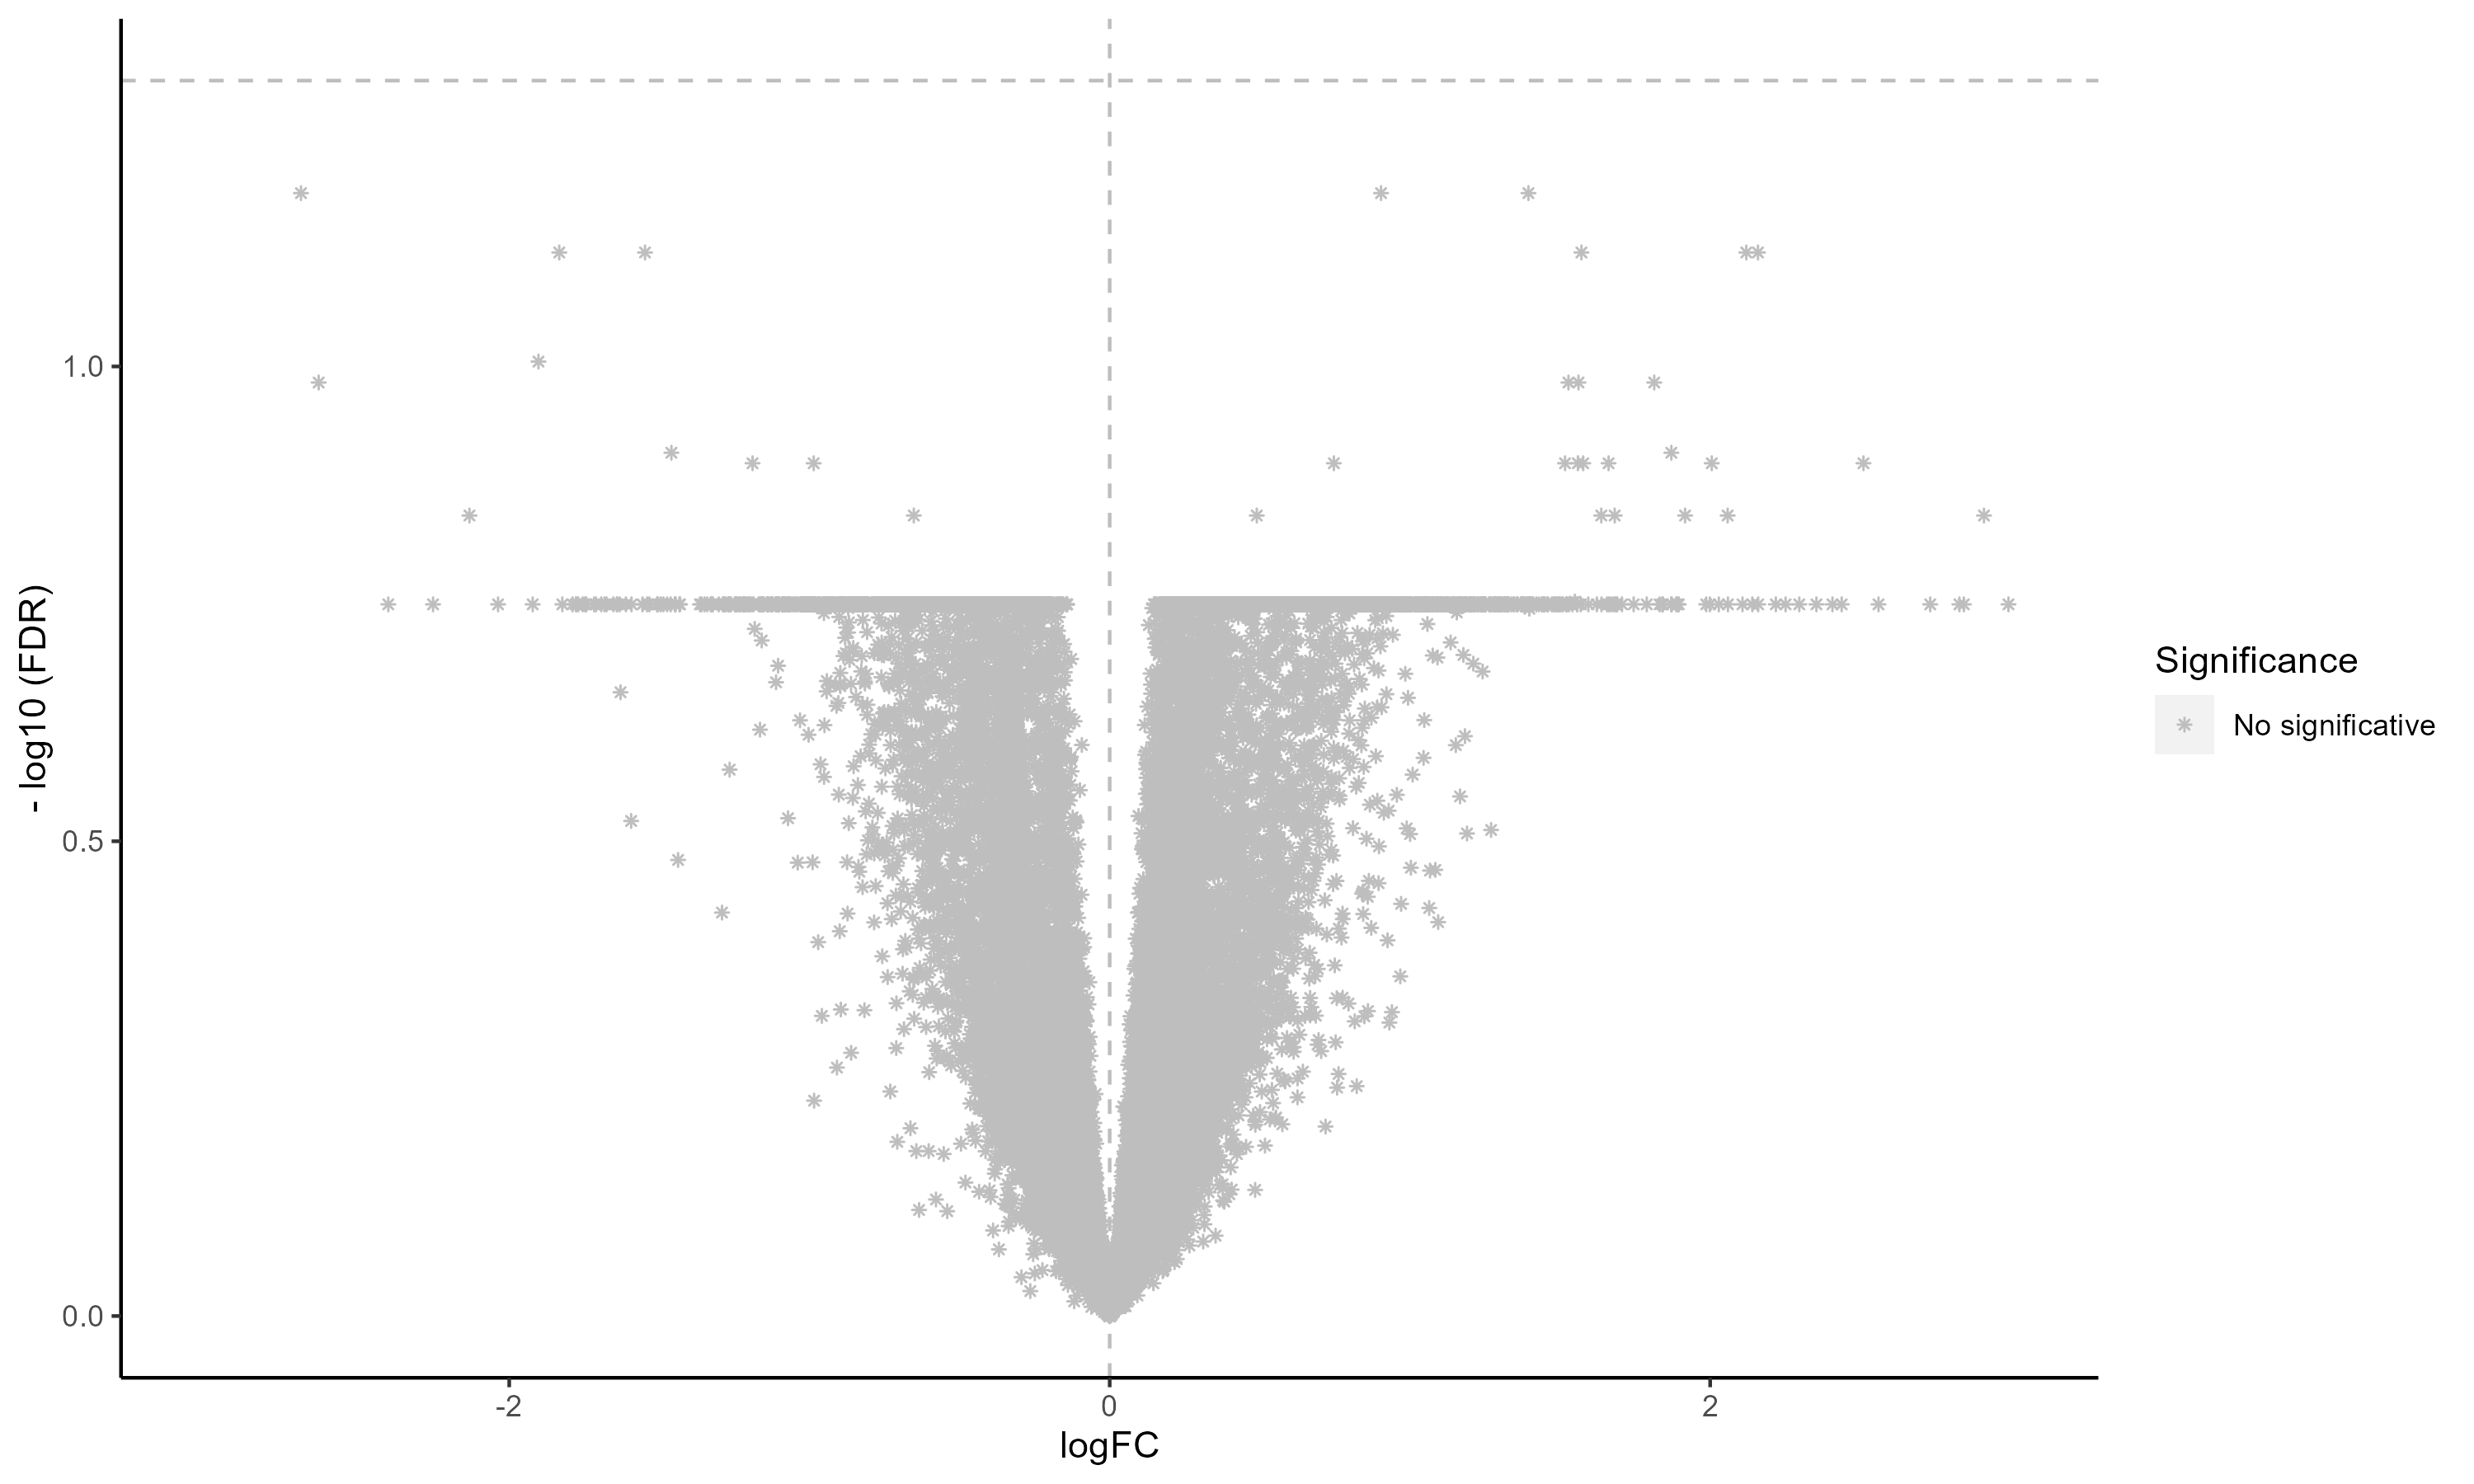
For full visualisation and exploitation of the results, please visit GSE29718.
-(Ob.F-C.F).png)
For full visualisation and exploitation of the results, please visit GSE64567.
-(Ob.F-C.F).png)
For full visualisation and exploitation of the results, please visit GSE92405.

-(Ob.F-C.F).png)
For full visualisation and exploitation of the results, please visit GSE141432.
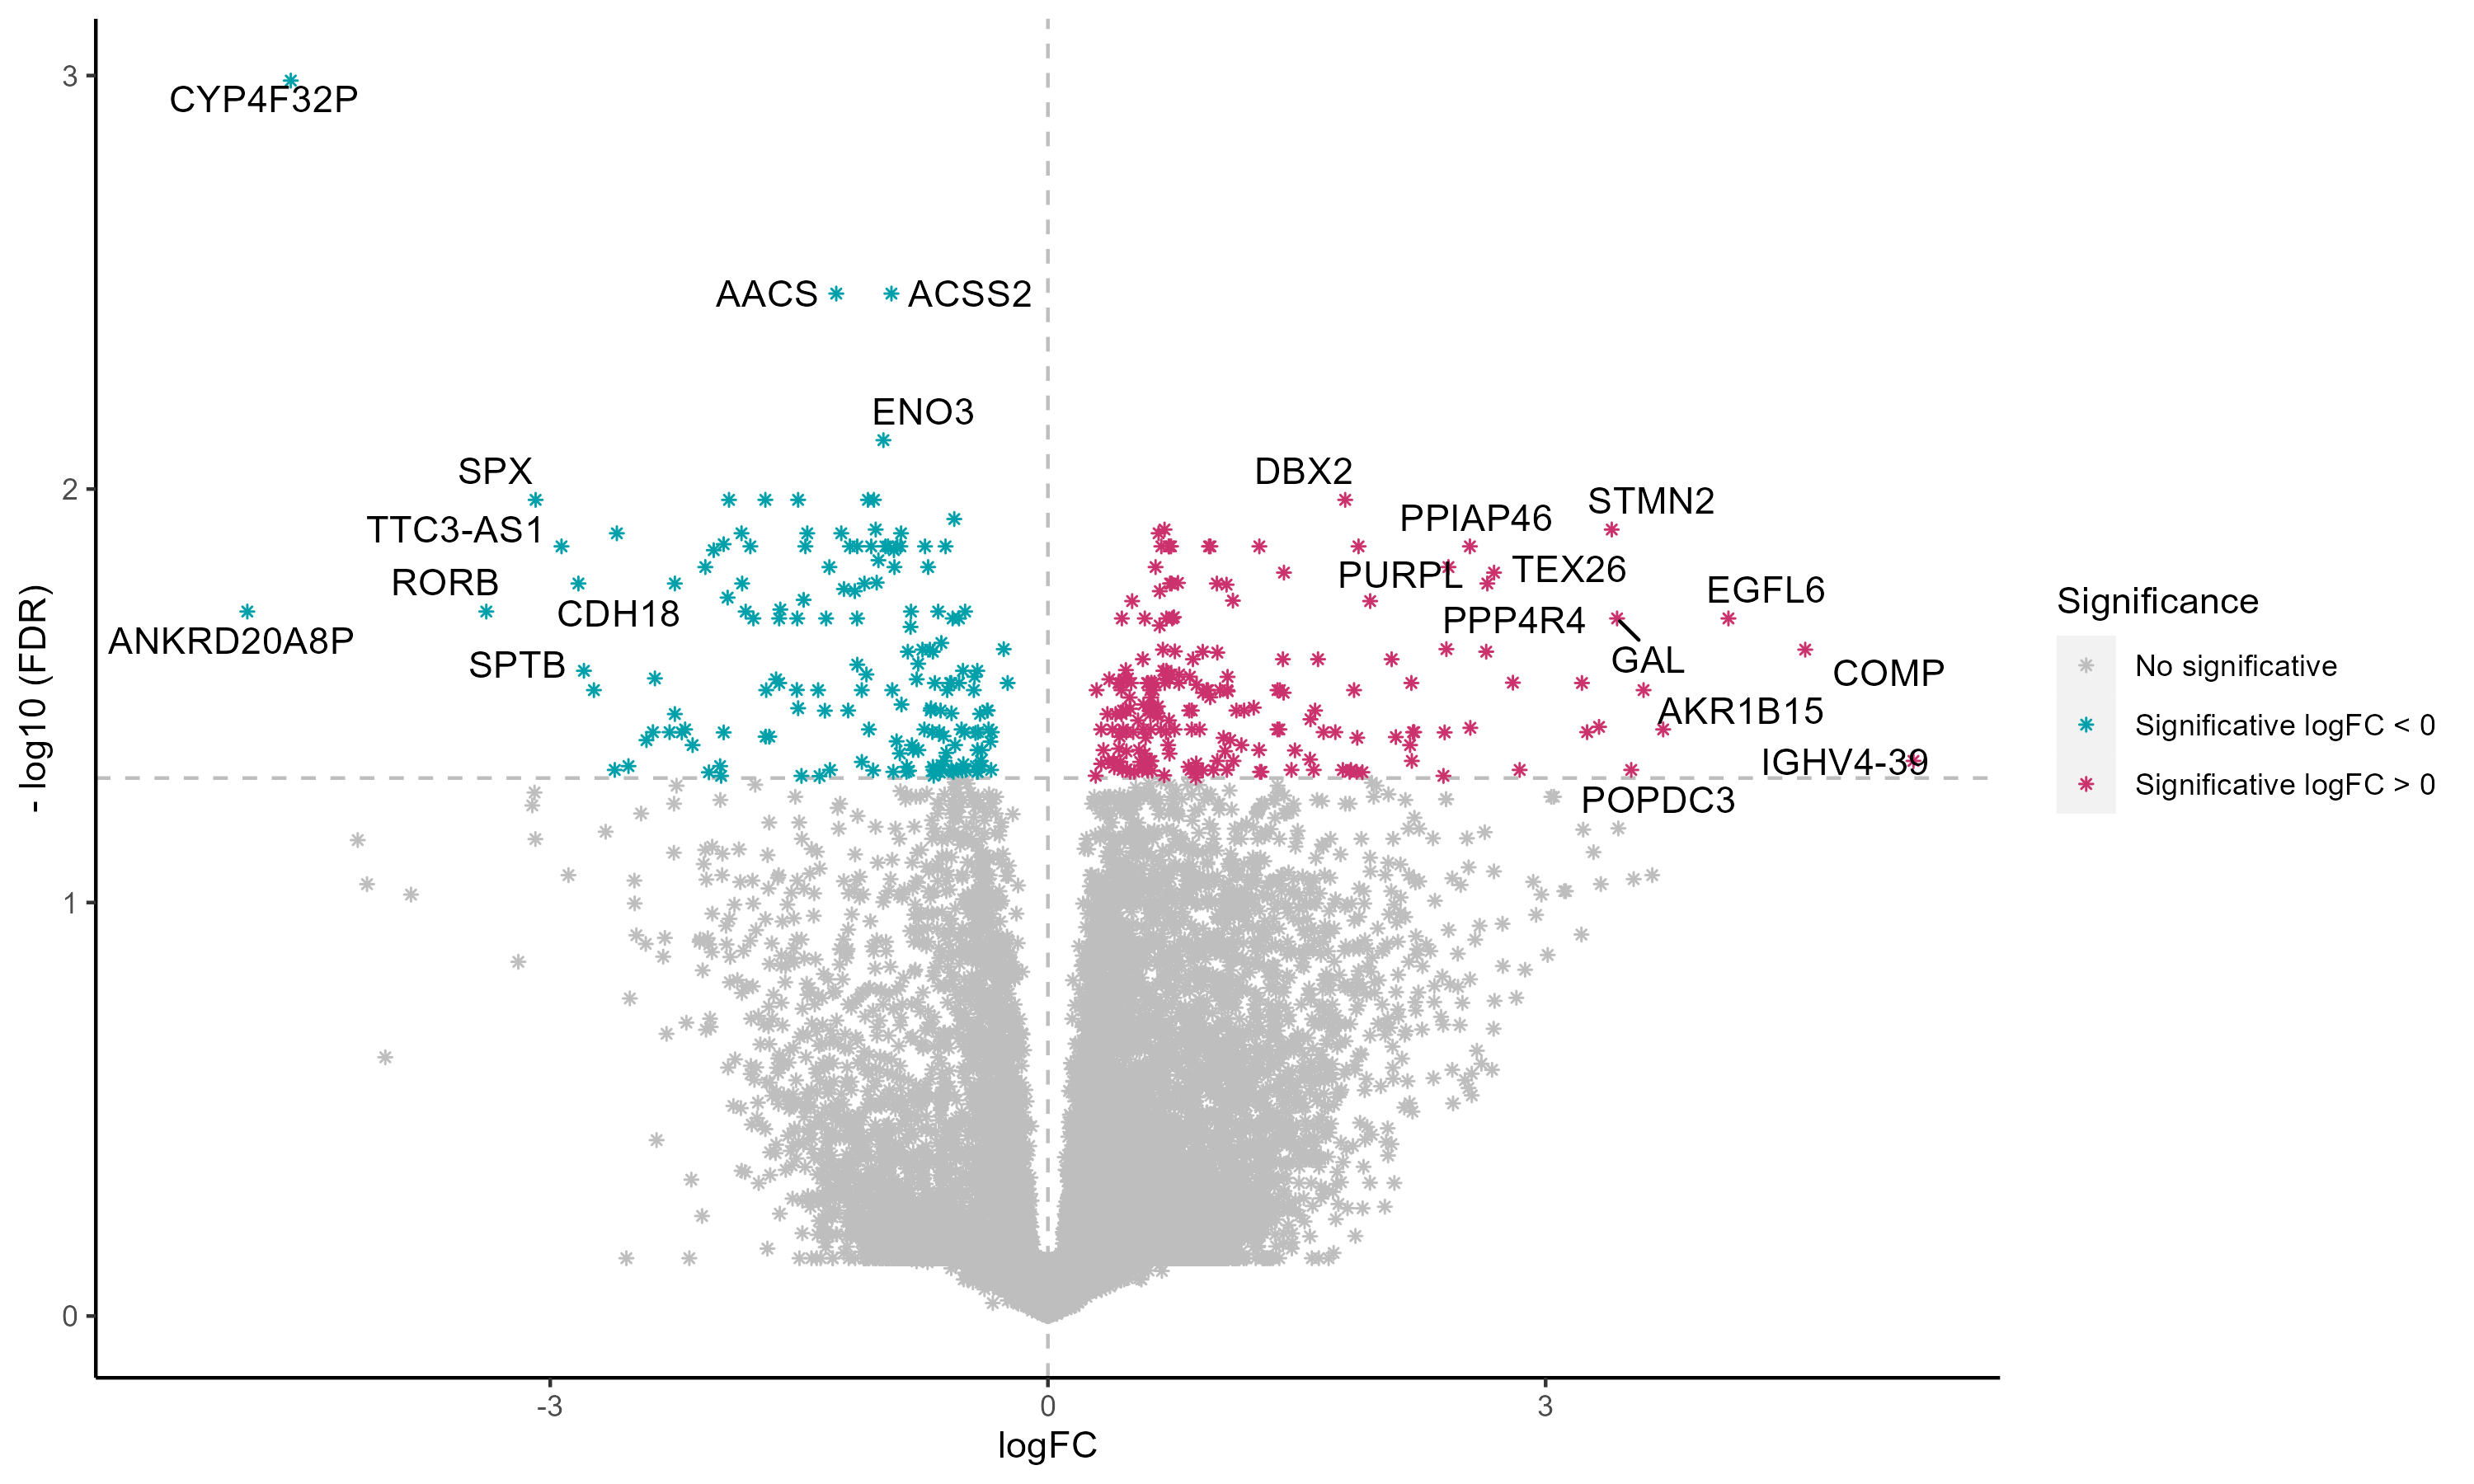
-(Ob.F-C.F).png)
For full visualisation and exploitation of the results, please visit GSE205668.
-(Ob.F-C.F).png)
Contrast | Studies | ||||||||
|---|---|---|---|---|---|---|---|---|---|
E_MEXP_1425 | GSE2508 | GSE20950 | GSE29718 | GSE64567 | GSE92405 | GSE141432 | GSE205668 | ||
ID | logFC > 0 | - | - | 4.670 | - | - | - | 0 | - |
logFC < 0 | - | - | 1.998 | - | - | - | 3 | - | |
Total | - | - | 6.668 | - | - | - | 3 | - | |
IDM | logFC > 0 | - | - | 509 | - | - | - | 0 | - |
logFC < 0 | - | - | 248 | - | - | - | 0 | - | |
Total | - | - | 757 | - | - | - | 0 | - | |
IDF | logFC > 0 | - | - | 2.736 | - | - | - | 0 | - |
logFC < 0 | - | - | 1.416 | - | - | - | 2 | - | |
Total | - | - | 4.152 | - | - | - | 2 | - | |
SDID | logFC > 0 | - | - | 0 | - | - | - | 0 | - |
logFC < 0 | - | - | 0 | - | - | - | 0 | - | |
Total | - | - | 0 | - | - | - | 0 | - | |
Total Number of Genes | 21367 | 19891 | 21367 | 19975 | 16589 | 21367 | 35795 | 35949 | |
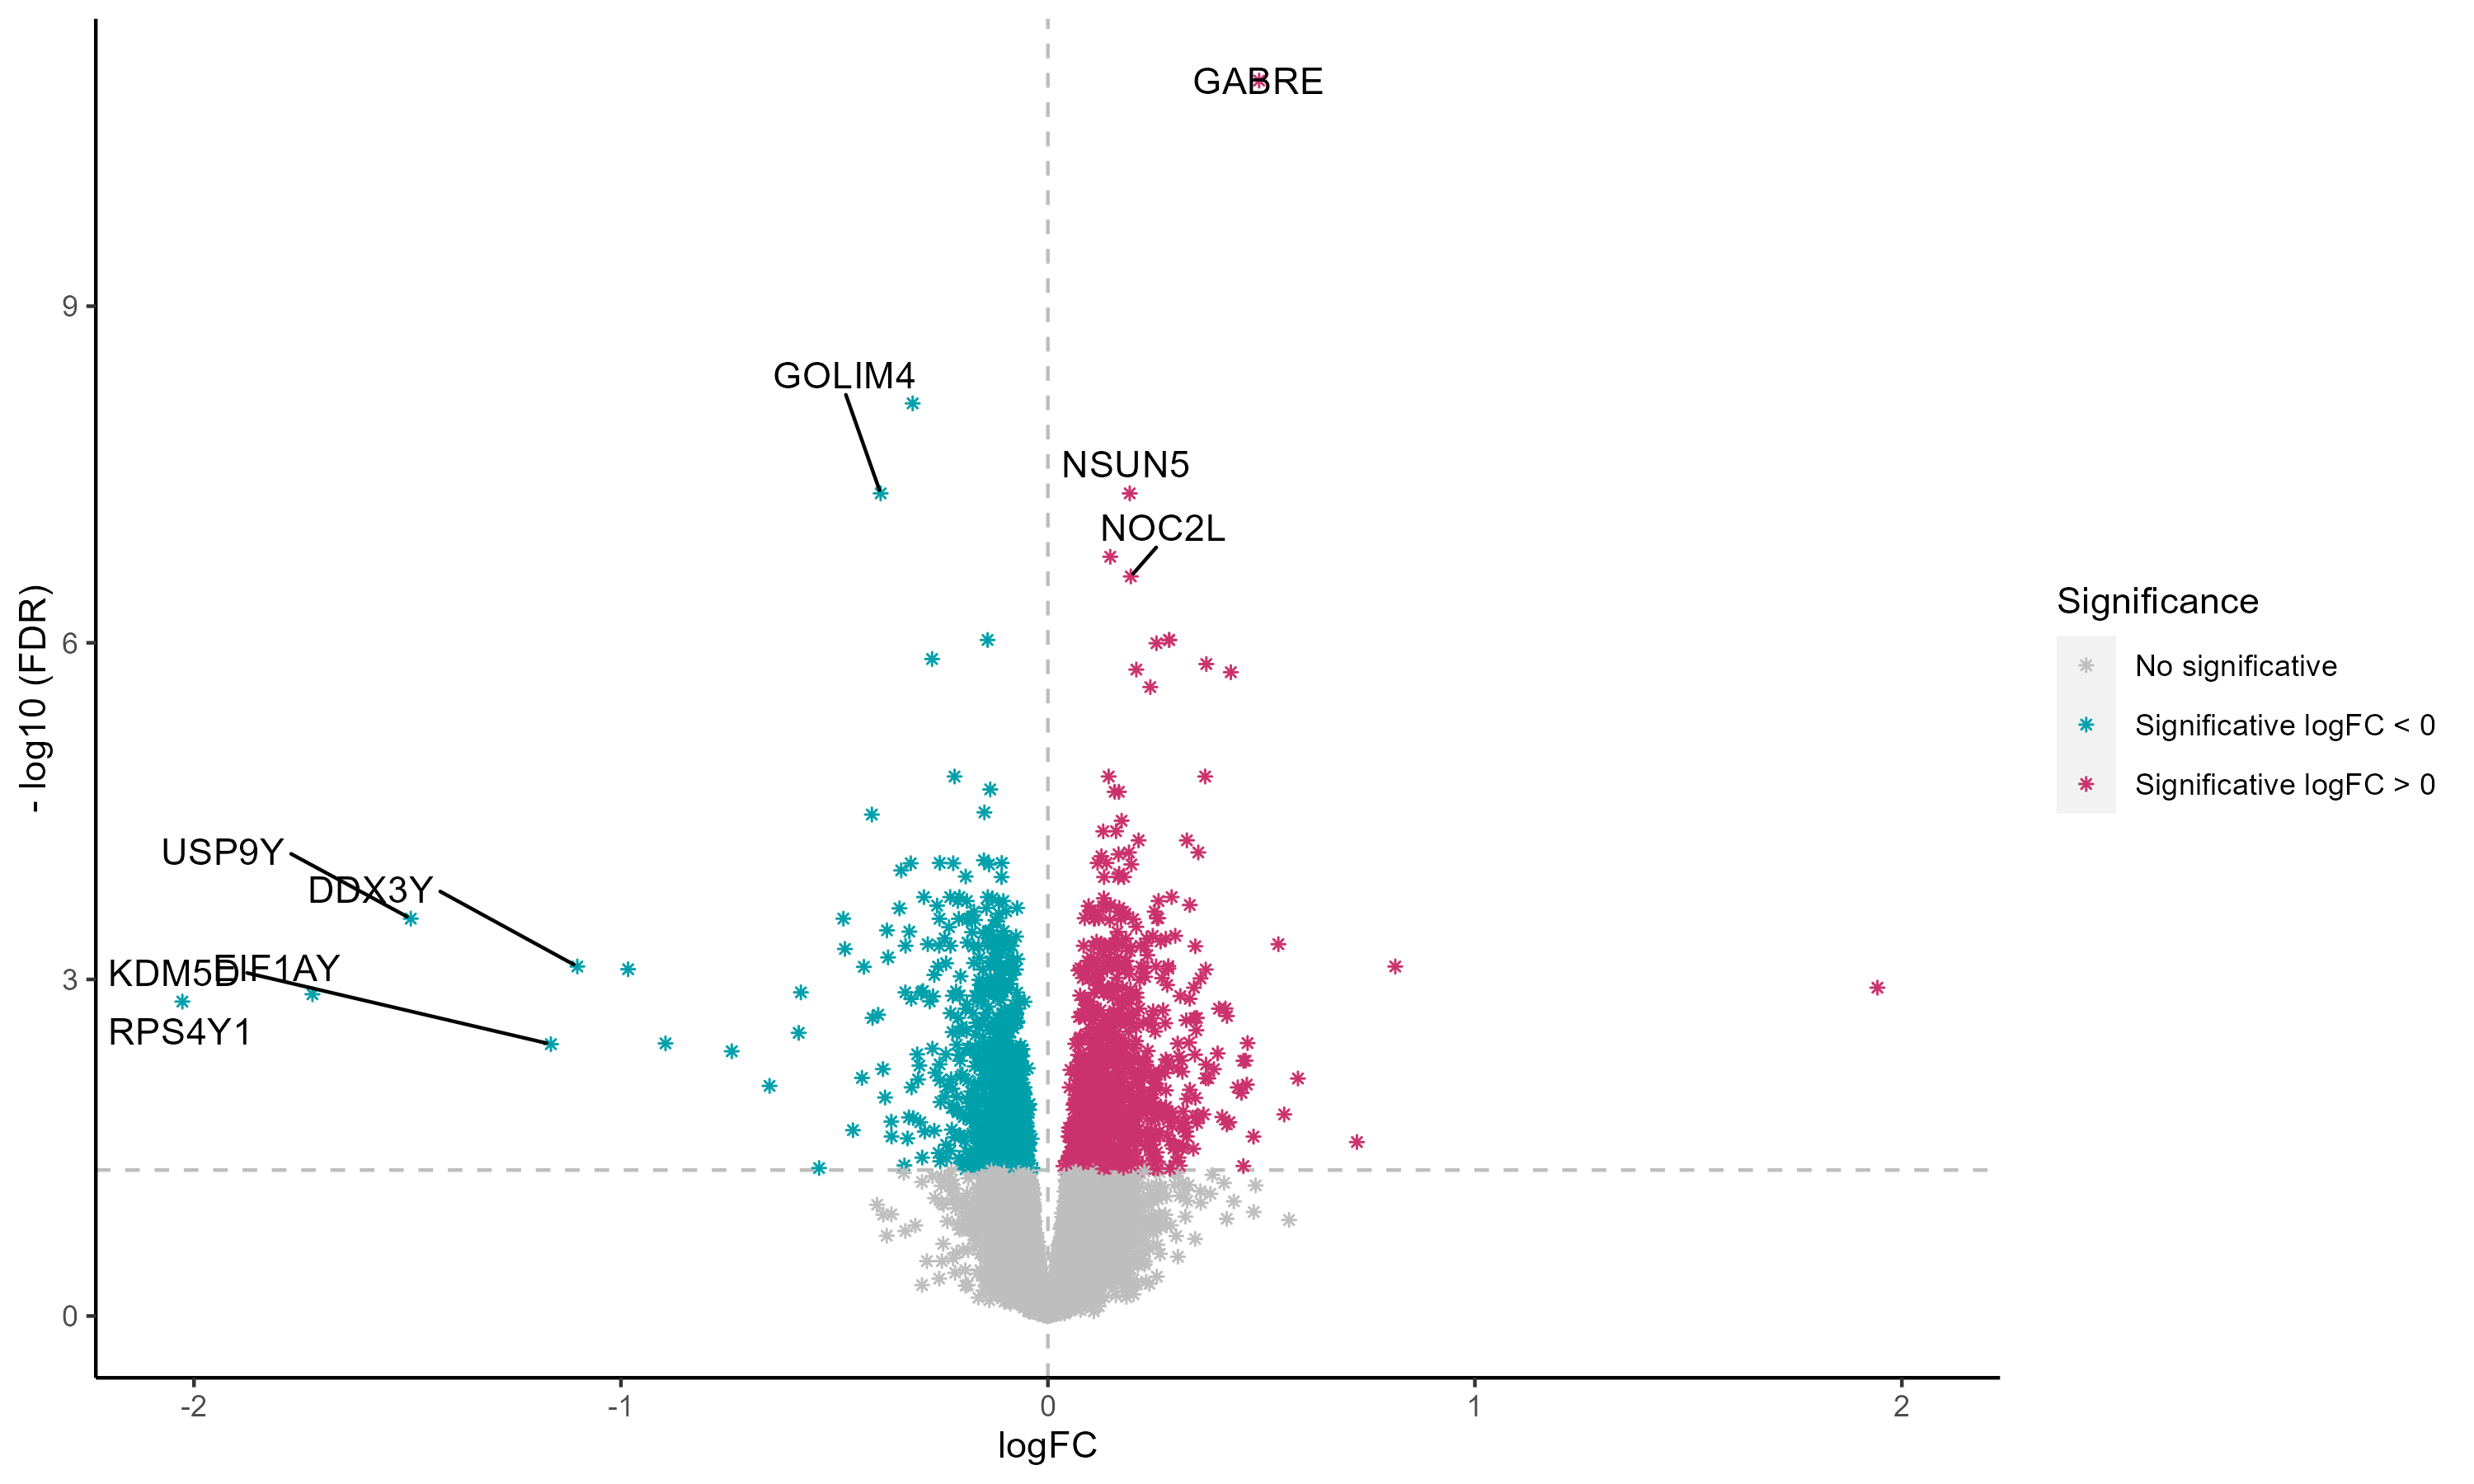
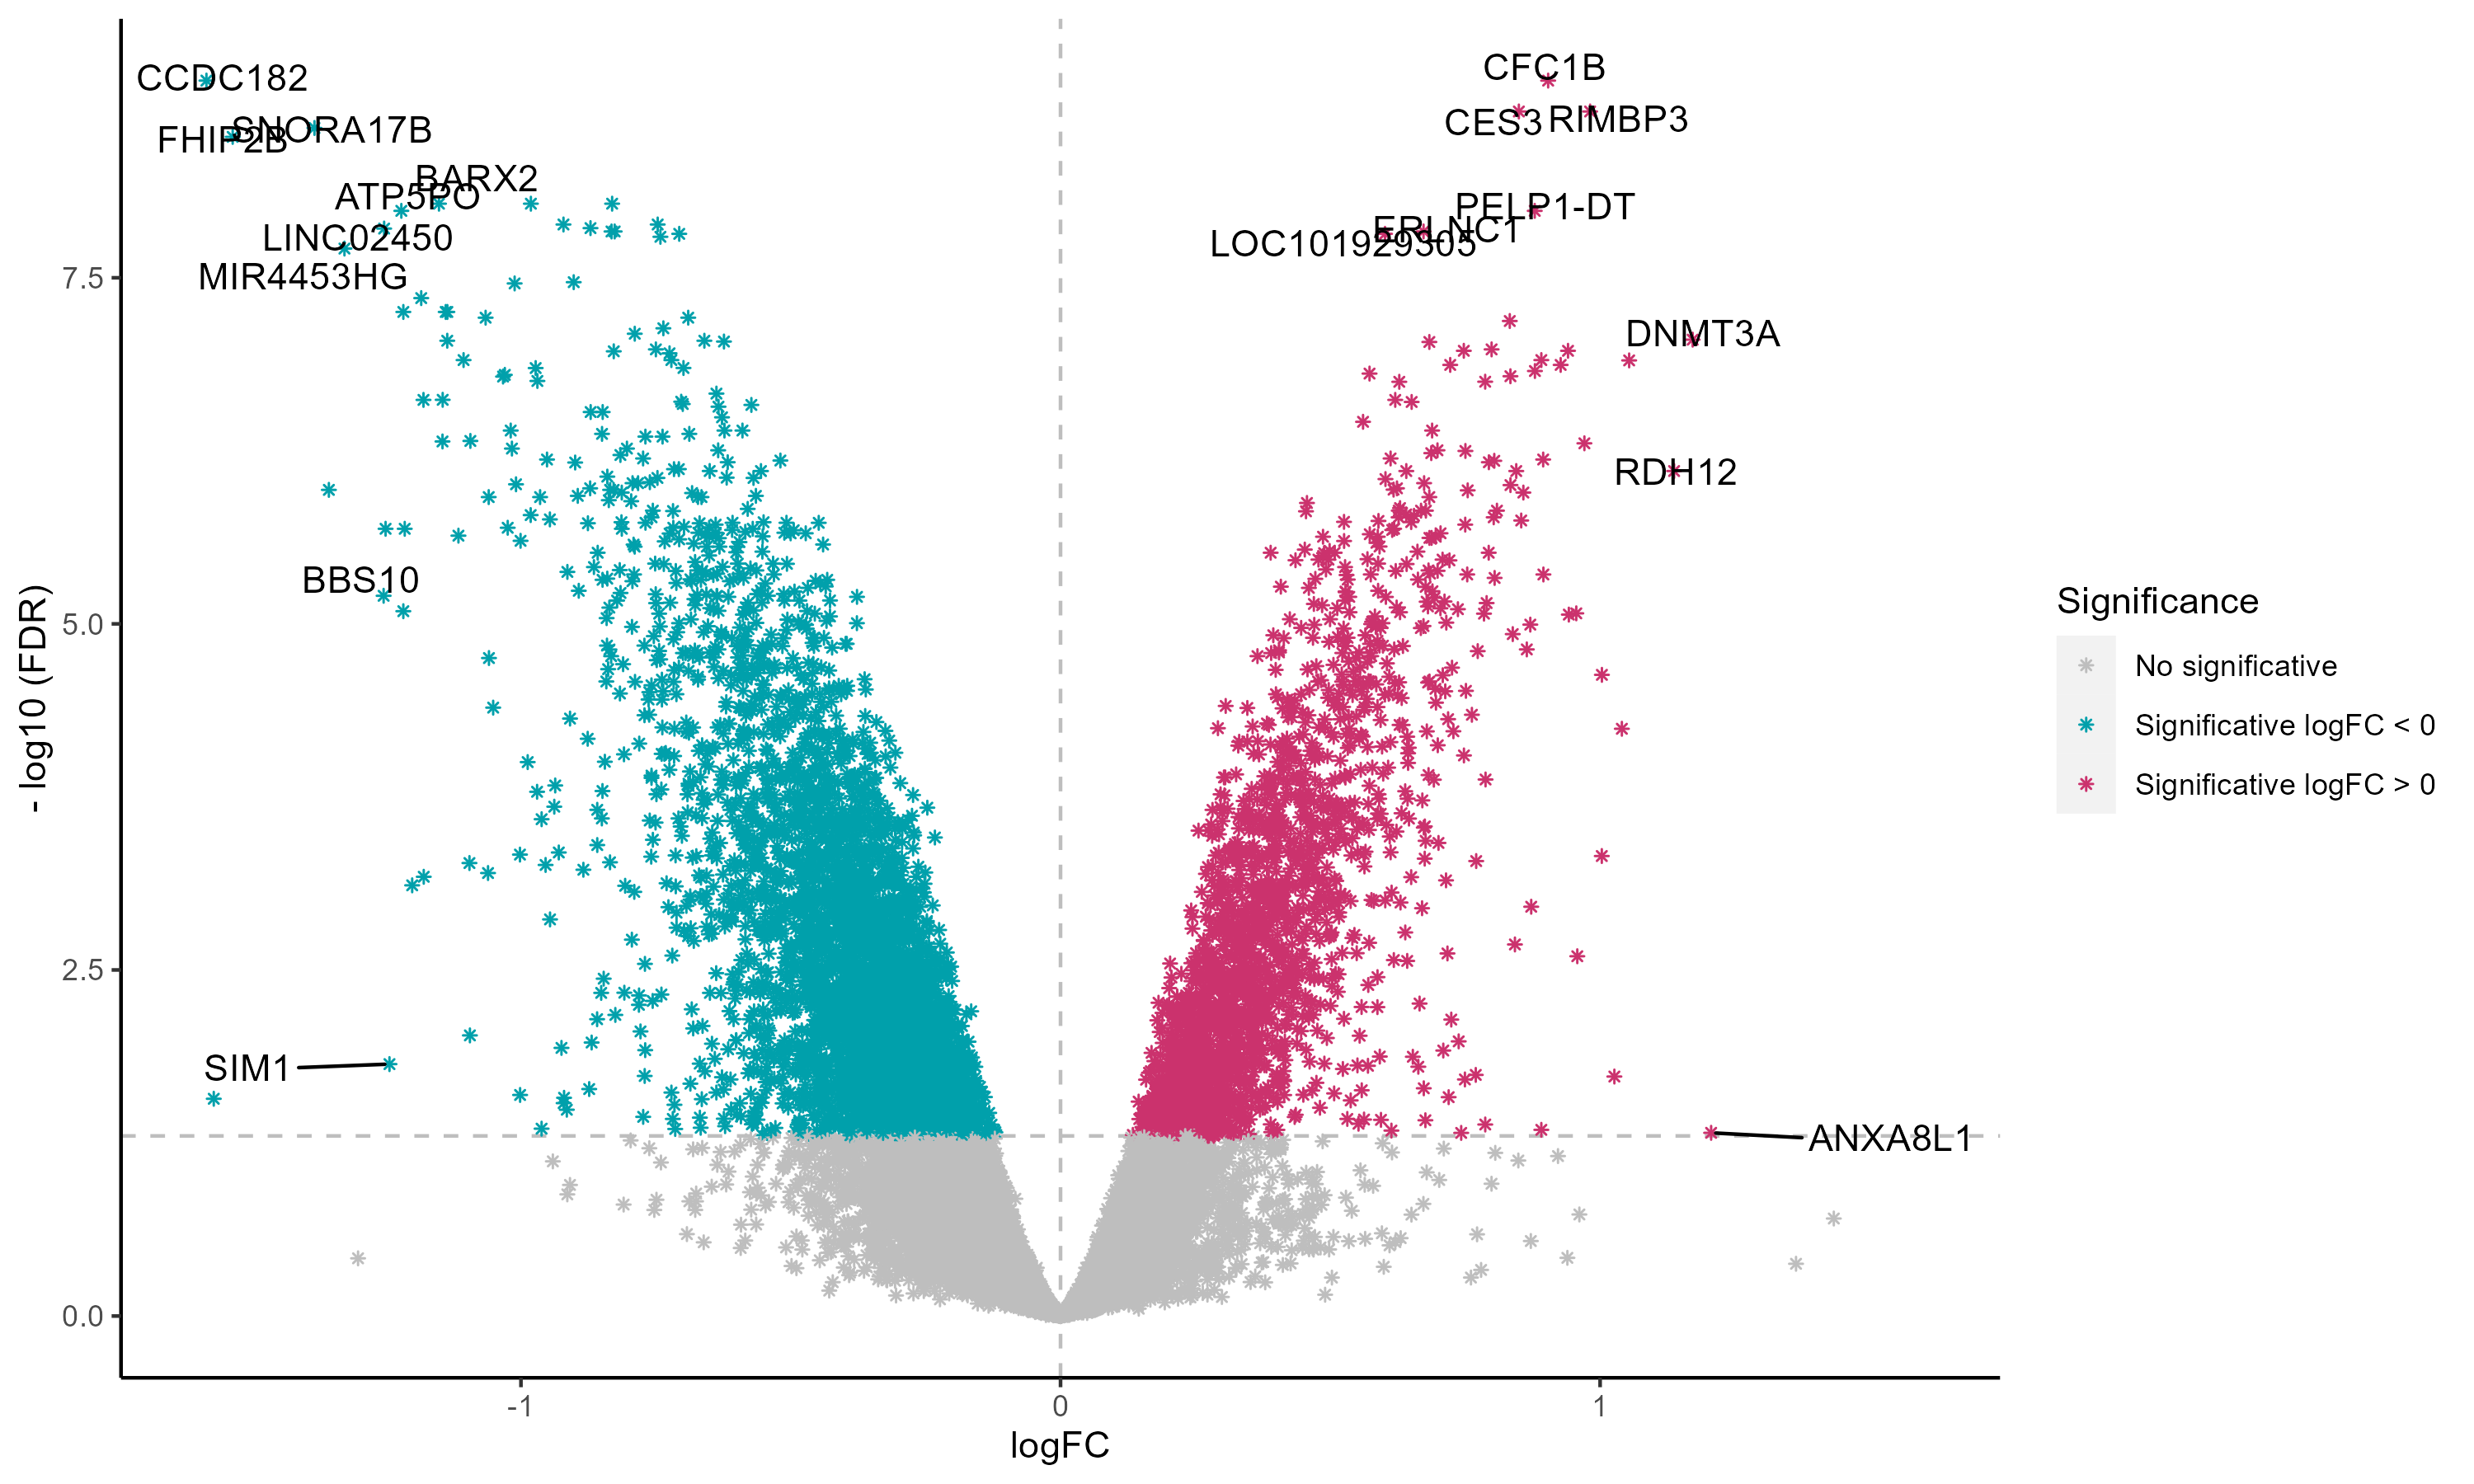
For full visualisation and exploitation of the results, please visit GSE20950.
-(T2D.F-Ob.F).png)
For full visualisation and exploitation of the results, please visit GSE141432.

-(T2D.F-Ob.F).png)