Methods
Bioinformatics and statistical analysis were run in R software v.3.5.3 [1]
1. Study search and selection
This review was conducted in June 2020, following the Preferred Reporting Items for Systematic Reviews and Meta-Analyses (PRISMA) statement guidelines (1). We searched the GEO datasets database (2) using the keywords: “NAFLD”, “NAFL”, “steatosis”, “NASH”, and “steatohepatitis” for transcriptomic studies published in English.
Study exclusion criteria
We applied the following exclusion criteria: (i) studies conducted in organisms other than humans; (ii) studies without information about the sex of the participants or that had not included both sexes; (iii) studies without individuals from the NAFL and NASH stages of the disease; (iv) studies in which the disease had not been diagnosed with a biopsy. In the latter case, we decided to require the use of a biopsy as the method for NAFLD and NASH diagnosis because other less invasive methods such as conventional imaging techniques have a low sensitivity to detect mild steatosis and/or to differentiate NAFL from NASH (3).2. Bioinformatics analysis strategy
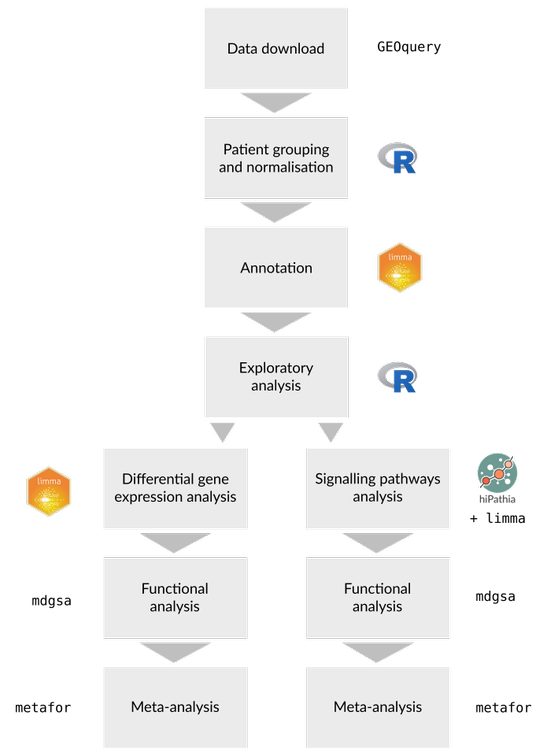
We applied the same three-step transcriptomic analysis strategy to each separate study: (i) data acquisition and preprocessing; (ii) differential gene expression and functional enrichment analysis; (iii) differential pathway activation and functional analysis. The functional results of all the studies were then integrated using meta-analysis techniques (Figure 1). This work was carried out using the programming language R 3.6.0 (4); information about the packages we used and their version numbers are provided in the supplementary material.
3. Data acquisition and preprocessing
During the data preprocessing we standardised the nomenclature of the different stages of the disease (by grouping the patients into Control, NAFL, and NASH groups) as well as the association of the probe identifiers with their corresponding genes. In those studies, with treated and untreated patients, treated patients were eliminated for further analysis. For studies that had used microarrays, the probe codes were transformed to their respective Entrez identifiers from the NCBI database (5).
For repeated probes, we calculated the median of their expression values. When available, data normalised by the original authors of the studies were used. Otherwise (studies GSE61260 and GSE66676), the raw data was normalised using the Robust Multichip Average (RMA) algorithm (6). The gene nomenclature in RNA-Seq studies was also standardised to the Entrez identifiers and the raw data matrix was processed using the TMM standardisation method (7) followed by a log-transformation of the data.
To meet the objective of this work, women were separated into premenopausal and postmenopausal groups. Since the selected studies did not include this information, we assumed that women aged under 50 years had been premenopausal, based on previous literature indicating that the average age of menopause is around 48–52 years (8,9).
After the normalisation of the data we attempted to detect any possible anomalous effects within the studies by completing an exploratory clustering and a principal component analysis (PCA).
4. Differential gene expression and functional enrichment analysis
We carried out a differential expression analysis of these studies using the limma and edgeR packages (10,11) to detect genes that were differentially expressed during the progression of NAFL to NASH in premenopausal women versus men. For each gene, we adjusted a linear model, which included possible batch effects, contrasting (NASH.W – NAFL.W) and (NASH.M – NAFL.M), where NASH.W, NAFL.W, NASH.M, and NAFL.M corresponded to NASH-affected premenopausal women, NAFL-affected premenopausal women, NASH-affected men, and NAFL-affected men, respectively. The statistics of the differential expression were calculated and the p-values were adjusted using the Benjamini & Hochberg (BH) method (12).
Next, based on the differential gene expression results, we performed a functional enrichment analysis using gene set analysis (GSA) (13). First, the genes were ordered according to their p-value and the sign of the contrast statistic. Next, the GSA was performed using the logistic regression model implemented in the mdgsa R package (14) along with their corresponding functional annotations obtained from the Gene Ontology (GO) (15) and Kyoto Encyclopaedia of Genes and Genomes (KEGG) PATHWAY (16) databases.
Because of their hierarchical structure, the gene annotations with GO terms applied in the mdgsa package were propagated so that they inherited the annotations of the ancestor terms. Excessively specific or generic annotations (blocks smaller than 10 or larger than 500 words) were subsequently filtered out. Finally, functions with a BH-adjusted p-value under 0.05 were considered significant.
For the two functional elements (GO terms and KEGG paths), we analysed the number of over-represented elements shared by the studies. These results were graphically represented as UpSet plots (17) to show the number of elements in common between the different sets. First, we compared the overrepresented elements as separate graphs to detect the common functions in each group: GO terms in premenopausal women, GO terms in men, KEGG pathways in premenopausal women, and KEGG pathways in men. We then visualised any significant GO terms in each of the individual studies in the same plot to highlight significant terms with different signs from among the studies.
5. Differential pathway activation and functional analysis
The Hipathia algorithm (18) was used to perform Pathway Activity Analysis (PAA). This method transforms gene expression values for stimulus-response signalling sub-pathways into the activation levels which ultimately trigger cellular responses. In this current work we used the hipathia R package to analyse 1,654 GO terms and 142 UniProt functions (19), associated with 146 KEGG routes (16).
The activation signal of each subpathway was computed from gene expression values using this algorithm. These values were used to detect significant differential activations in the (NASH.W – NAFL.W) – (NASH.M – NAFL.M) contrast pair (as defined above). The functional annotations included in Hipathia and the differential activation results were integrated using the GSA method to identify differences at the functional level (GO terms and UniProt functions) in relation to progression of the disease.
5. Meta-analysis
Once the gene functional analysis was applied to each individual study, we carried out a functional meta-analysis to summarise the results. Similarly, once the pathway functional analysis was applied to each individual study, the results were summarised via a homologous functional meta-analysis.
Both meta-analyses were performed following the methodology described in detail in García-García (20). Briefly, the metafor R package (21) was used to evaluate the combined effect with a random-effects model; this model more precisely detects overrepresented elements than performing the studies individually at a higher statistical power. Likewise, variability in the individual studies was incorporated into the global estimation of the measured effect so that less-variable results had a higher weight in the overall calculation of the logarithm of the odds ratio (LOR). Finally, we confirmed the suitability of the selected studies by evaluating the heterogeneity of these indicators.
For each meta-analysis and function, p-values (adjusted using the BH method), LORs, and 95% confidence intervals (CIs) were calculated. A term was considered significant when its adjusted p-value was lower than 0.05; a positive LOR in significant functions indicated a greater overrepresentation in premenopausal women than in men. In contrast, a negative LOR indicated higher representation in men than in premenopausal women. Finally, funnel plots and forest plots were used to assess the variability and to measure the contribution of each study to the meta-analysis.
A total of 8,223 elements were analysed in the gene functional meta-analysis (7,994 GO terms and 229 KEGG pathways); 1,654 GO terms and 142 UniProt functions were assessed in the functional pathway meta-analysis (20) in association with 146 KEGG pathways (16).
References
- Moher D, Liberati A, Tetzlaff J, Altman DG. Preferred Reporting Items for Systematic Reviews and Meta-Analyses: The PRISMA Statement. PLoS Med. 2009;6:e1000097. Available from: https://dx.plos.org/10.1371/journal.pmed.1000097
- Barrett T, Wilhite SE, Ledoux P, Evangelista C, Kim IF, Tomashevsky M, et al. NCBI GEO: archive for functional genomics data sets—update. Nucleic Acids Res. 2012;41:D991-D995. Available from: http://academic.oup.com/nar/article/41/D1/D991/1067995/NCBI-GEO-archive-for-functional-genomics-data
- Aller R, Fernández-Rodríguez C, lo Iacono O, Bañares R, Abad J, Carrión JA, et al. Consensus document. Management of non-alcoholic fatty liver disease (NAFLD). Clinical practice guideline. Gastroenterol. y Hepatol. English Ed. 2018;41:328-349. Available from: https://linkinghub.elsevier.com/retrieve/pii/S0210570518300037
- R Core Team. R: A Language and Environment for Statistical Computing. 2019;Available from: http://www.r-project.org/
- Maglott D. Entrez Gene: gene-centered information at NCBI. Nucleic Acids Res. 2004;33:D54-D58. Available from: https://academic.oup.com/nar/article-lookup/doi/10.1093/nar/gki031
- Bolstad BM, Irizarry RA, Astrand M, Speed TP. A comparison of normalization methods for high density oligonucleotide array data based on variance and bias. Bioinformatics. 2003;19:185-193. Available from: https://academic.oup.com/bioinformatics/article-lookup/doi/10.1093/bioinformatics/19.2.185
- Robinson MD, Oshlack A. A scaling normalization method for differential expression analysis of RNA-seq data. Genome Biol. 2010;11:R25. Available from: http://genomebiology.biomedcentral.com/articles/10.1186/gb-2010-11-3-r25
- Davis SR, Lambrinoudaki I, Lumsden M, Mishra GD, Pal L, Rees M, et al. Menopause. Nat. Rev. Dis. Prim. 2015;1:15004. Available from: http://www.nature.com/articles/nrdp20154
- Freeman EW, Sammel MD, Sanders RJ. Risk of long-term hot flashes after natural menopause. Menopause. 2014;21:924-932. Available from: http://journals.lww.com/00042192-201409000-00005
- Ritchie ME, Phipson B, Wu D, Hu Y, Law CW, Shi W, et al. limma powers differential expression analyses for RNA-sequencing and microarray studies. Nucleic Acids Res. 2015;43:e47-e47. Available from: https://doi.org/10.1093/nar/gkv007
- Robinson MD, McCarthy DJ, Smyth GK. edgeR: a Bioconductor package for differential expression analysis of digital gene expression data. Bioinformatics. 2010;26:139-140. Available from: https://academic.oup.com/bioinformatics/article-lookup/doi/10.1093/bioinformatics/btp616
- Benjamini Y, Hochberg Y. Controlling the False Discovery Rate: A Practical and Powerful Approach to Multiple Testing. J. R. Stat. Soc. Ser. B. 1995;57:289-300. Available from: http://www.jstor.org/stable/2346101
- Subramanian A, Tamayo P, Mootha VK, Mukherjee S, Ebert BL, Gillette MA, et al. Gene set enrichment analysis: A knowledge-based approach for interpreting genome-wide expression profiles. Proc. Natl. Acad. Sci. 2005;102:15545-15550. Available from: http://www.pnas.org/cgi/doi/10.1073/pnas.0506580102
- Montaner D, Dopazo J. Multidimensional Gene Set Analysis of Genomic Data. PLoS One. 2010;5:e10348. Available from: https://dx.plos.org/10.1371/journal.pone.0010348
- Ashburner M, Ball CA, Blake JA, Botstein D, Butler H, Cherry JM, et al. Gene Ontology: tool for the unification of biology. Nat. Genet. 2000;25:25-29. Available from: http://www.nature.com/doifinder/10.1038/75556
- Kanehisa M, Goto S. KEGG: Kyoto Encyclopedia of Genes and Genomes. Nucleic Acids Res. 2000;28:27-30. Available from: https://academic.oup.com/nar/article-lookup/doi/10.1093/nar/27.1.29
- Lex A, Gehlenborg N. Sets and intersections. Nat. Methods. 2014;11:779-779. Available from: http://www.nature.com/articles/nmeth.3033
- Hidalgo MR, Cubuk C, Amadoz A, Salavert F, Carbonell-Caballero J, Dopazo J. High throughput estimation of functional cell activities reveals disease mechanisms and predicts relevant clinical outcomes. Oncotarget. 2017;8. Available from: http://www.oncotarget.com/fulltext/14107
- The UniProt Consortium. UniProt: the universal protein knowledgebase. Nucleic Acids Res.. 2016;45:D158-D169. Available from: https://doi.org/10.1093/nar/gkw1099
- García-García F. Métodos de análisis de enriquecimiento funcional en estudios genómicos. 2016. Available from: https://www.educacion.gob.es/teseo/mostrarRef.do?ref=1307283
- Viechtbauer W. Conducting Meta-Analyses in R with the metafor Package. J. Stat. Softw. 2010;36. Available from: http://www.jstatsoft.org/v36/i03/