Summary


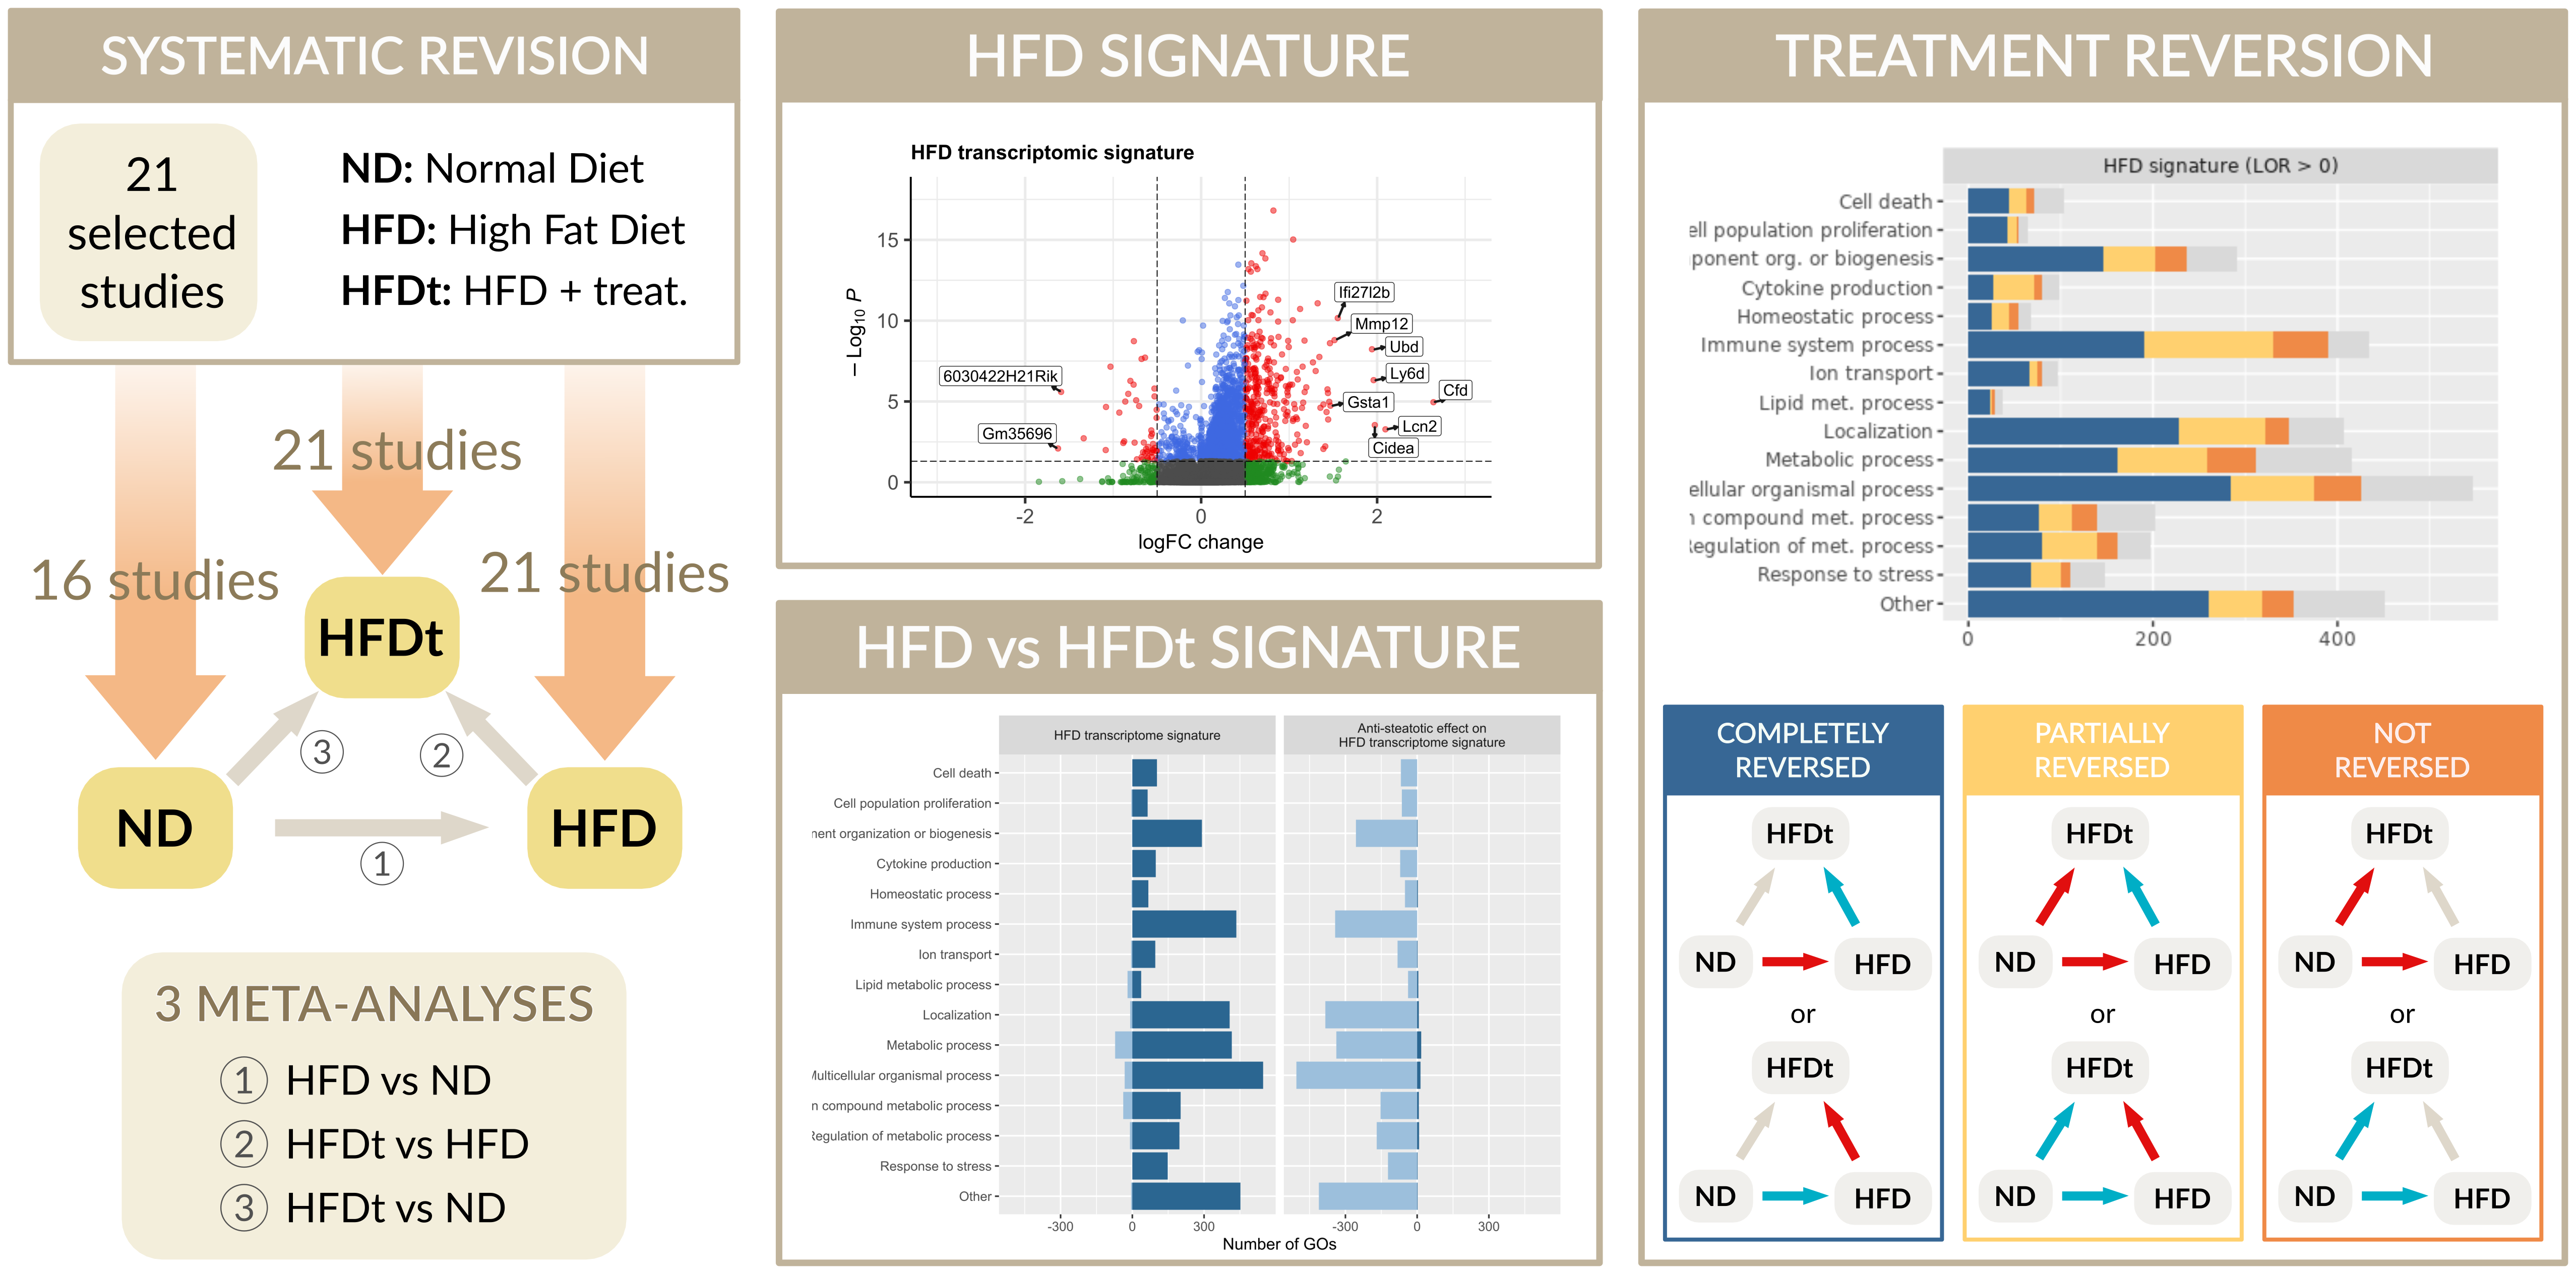
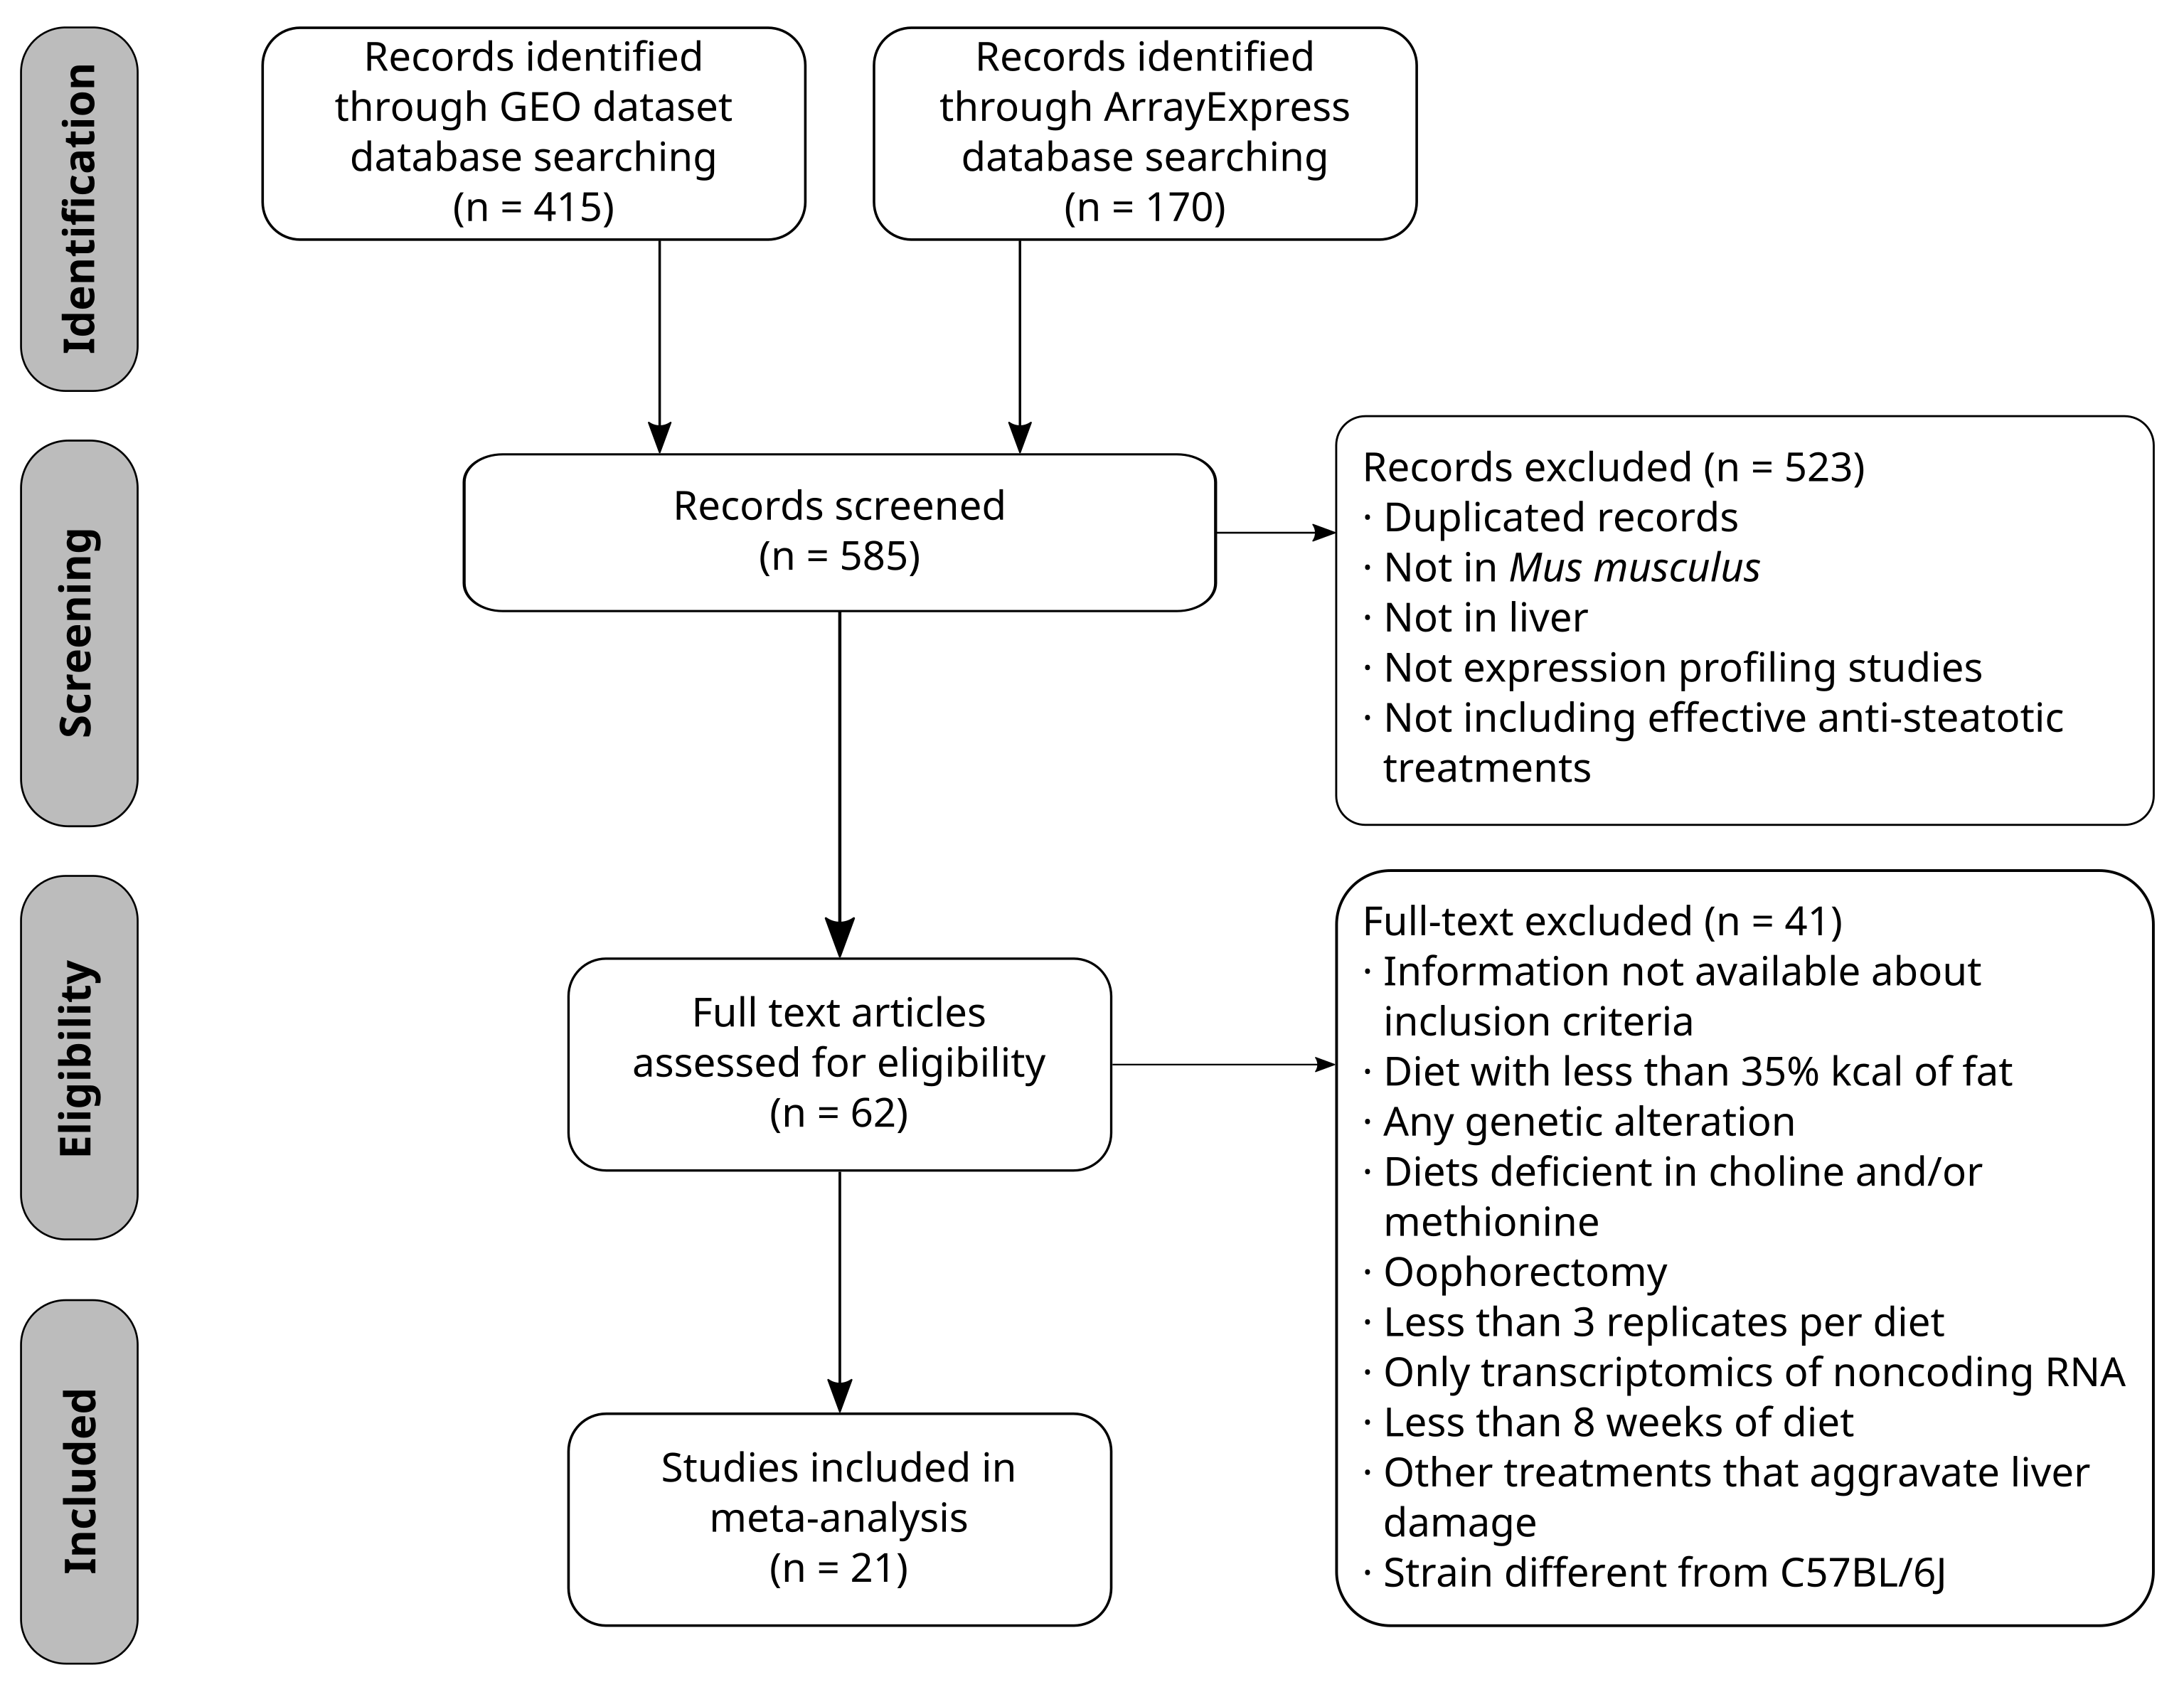
Graphical abstract. We carried out a systematic review in GEO database for transcriptomic studies comparing the hepatic gene expression of wild type HFD-fed C57BL6/J mice with that of control mice (normal diet, ND), and that of HFD-fed mice receiving potential anti-steatotic treatments. After performing a differential gene expression analysis, we conducted a meta-analysis to define the hepatic gene expression signature of HFD mice. We also evaluated the capacity of the anti-steatotic treatments to modulate this transcriptomic signature.
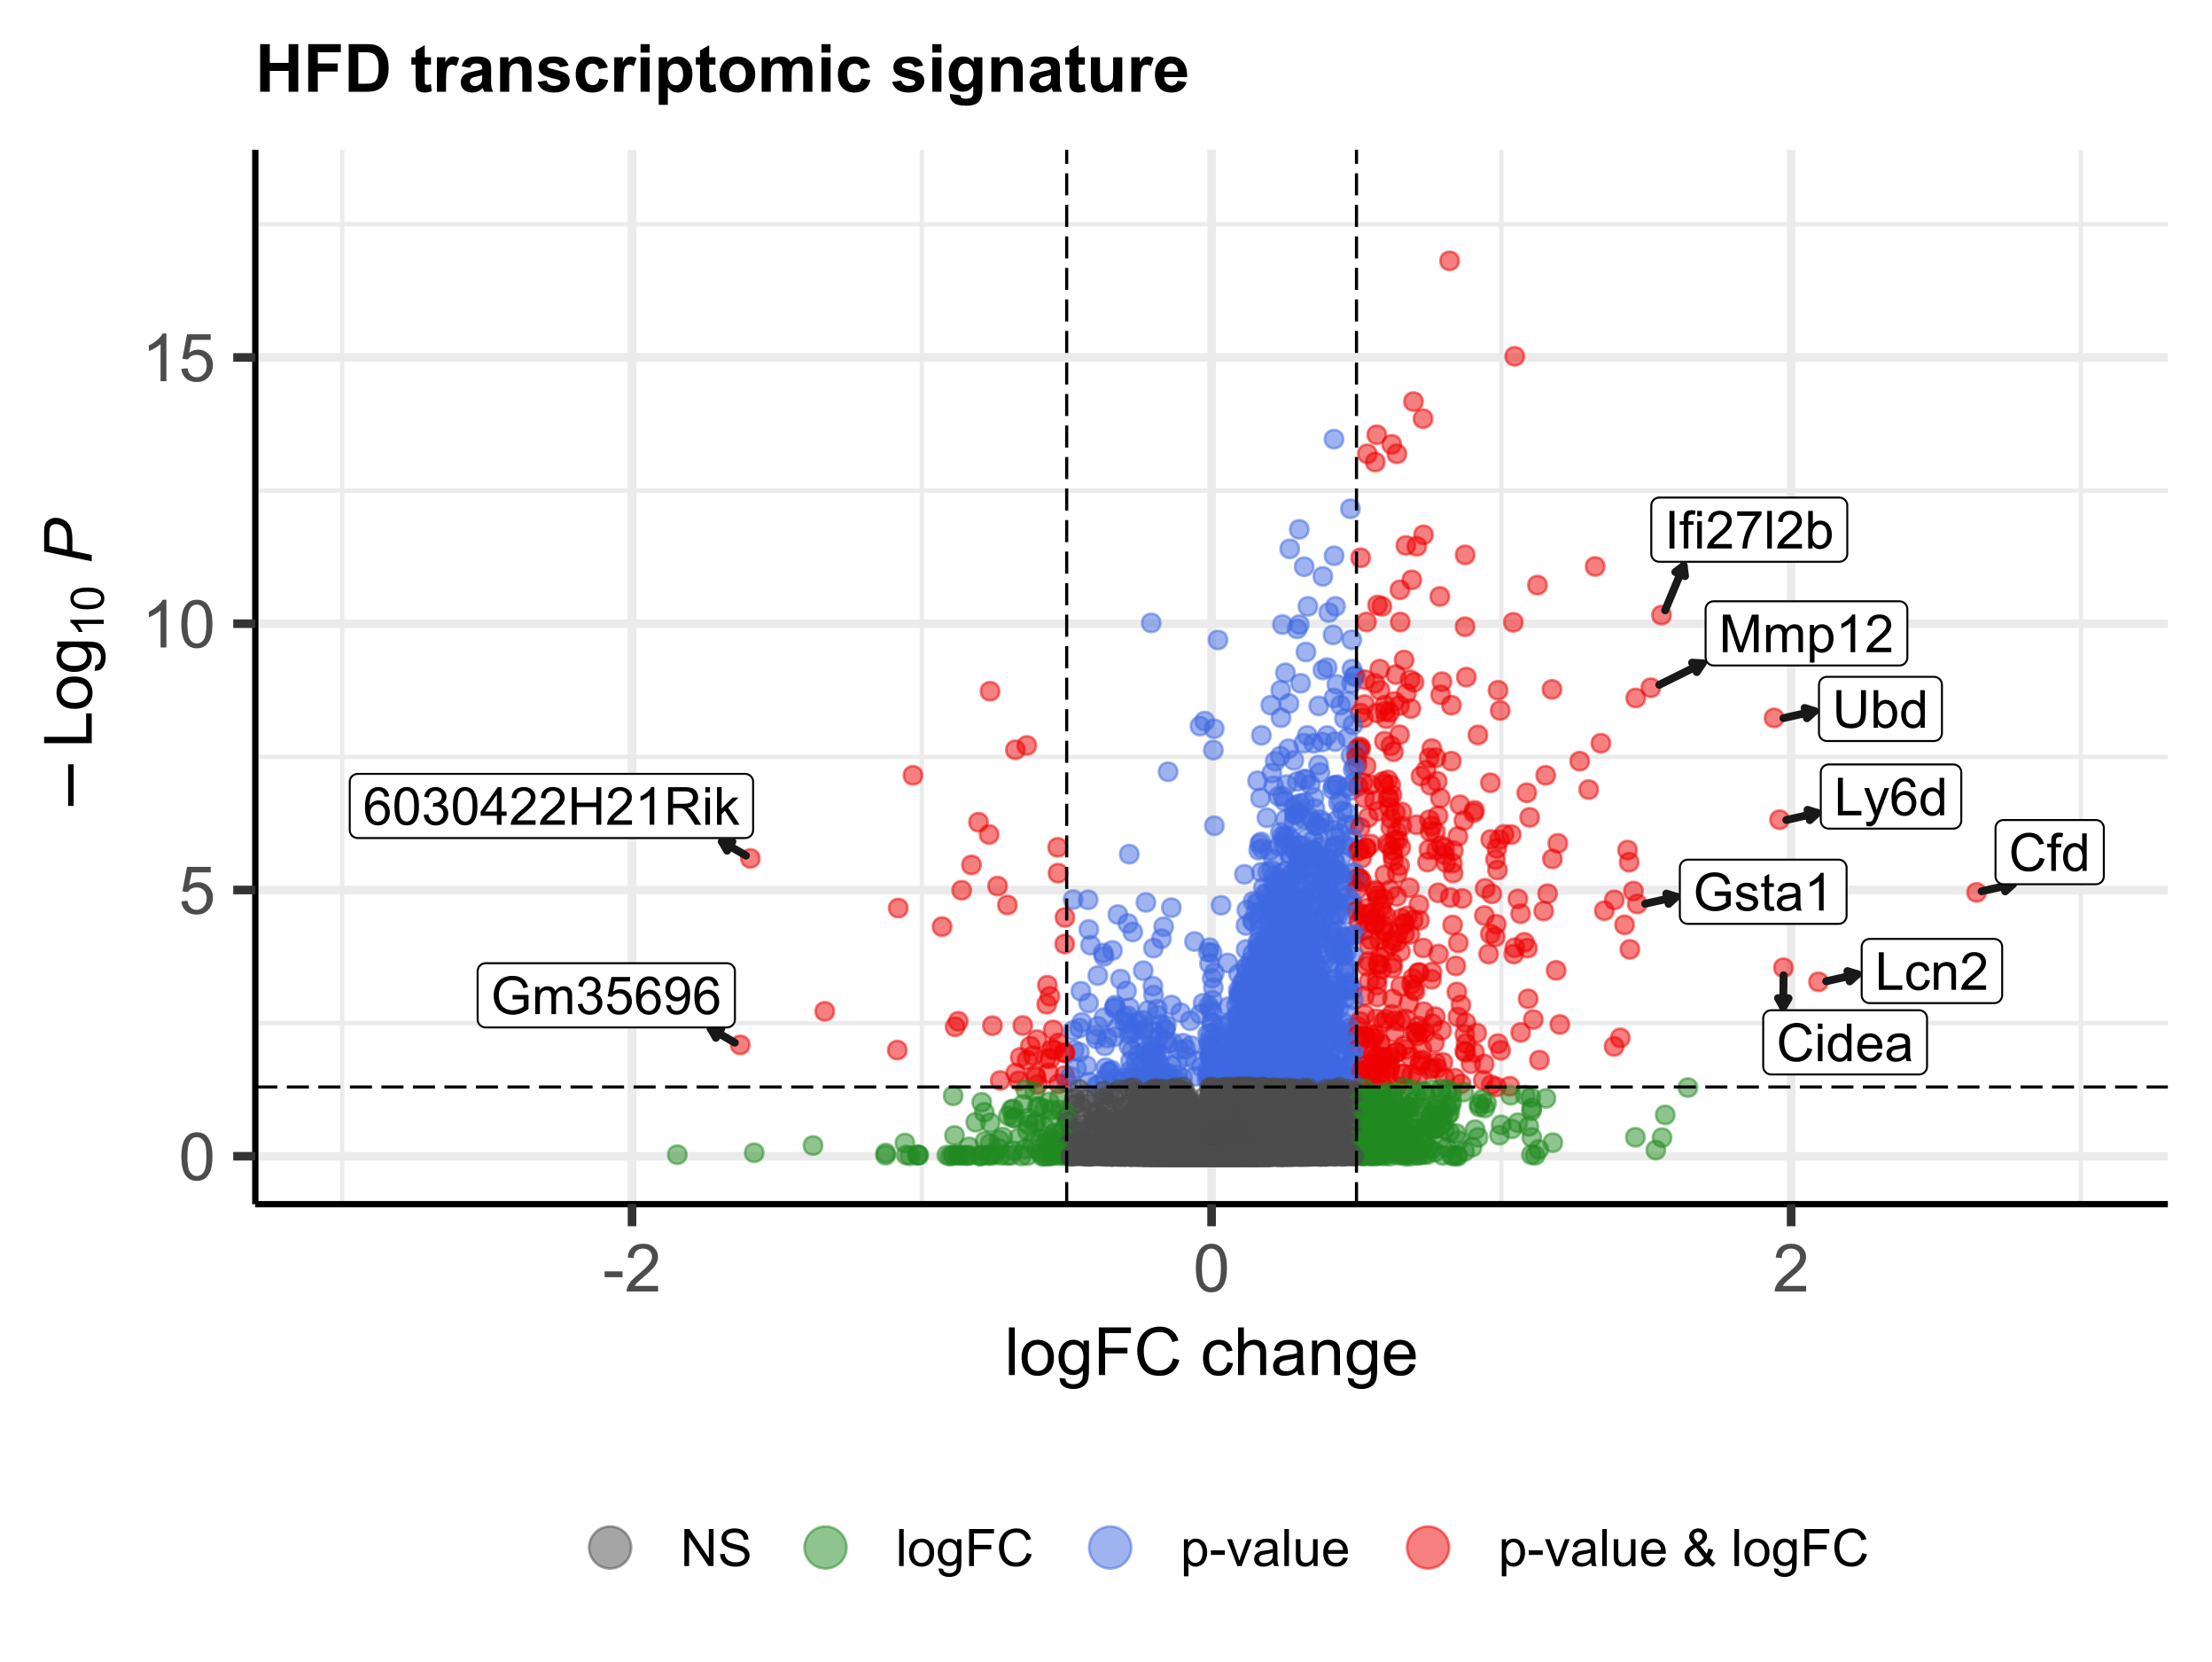
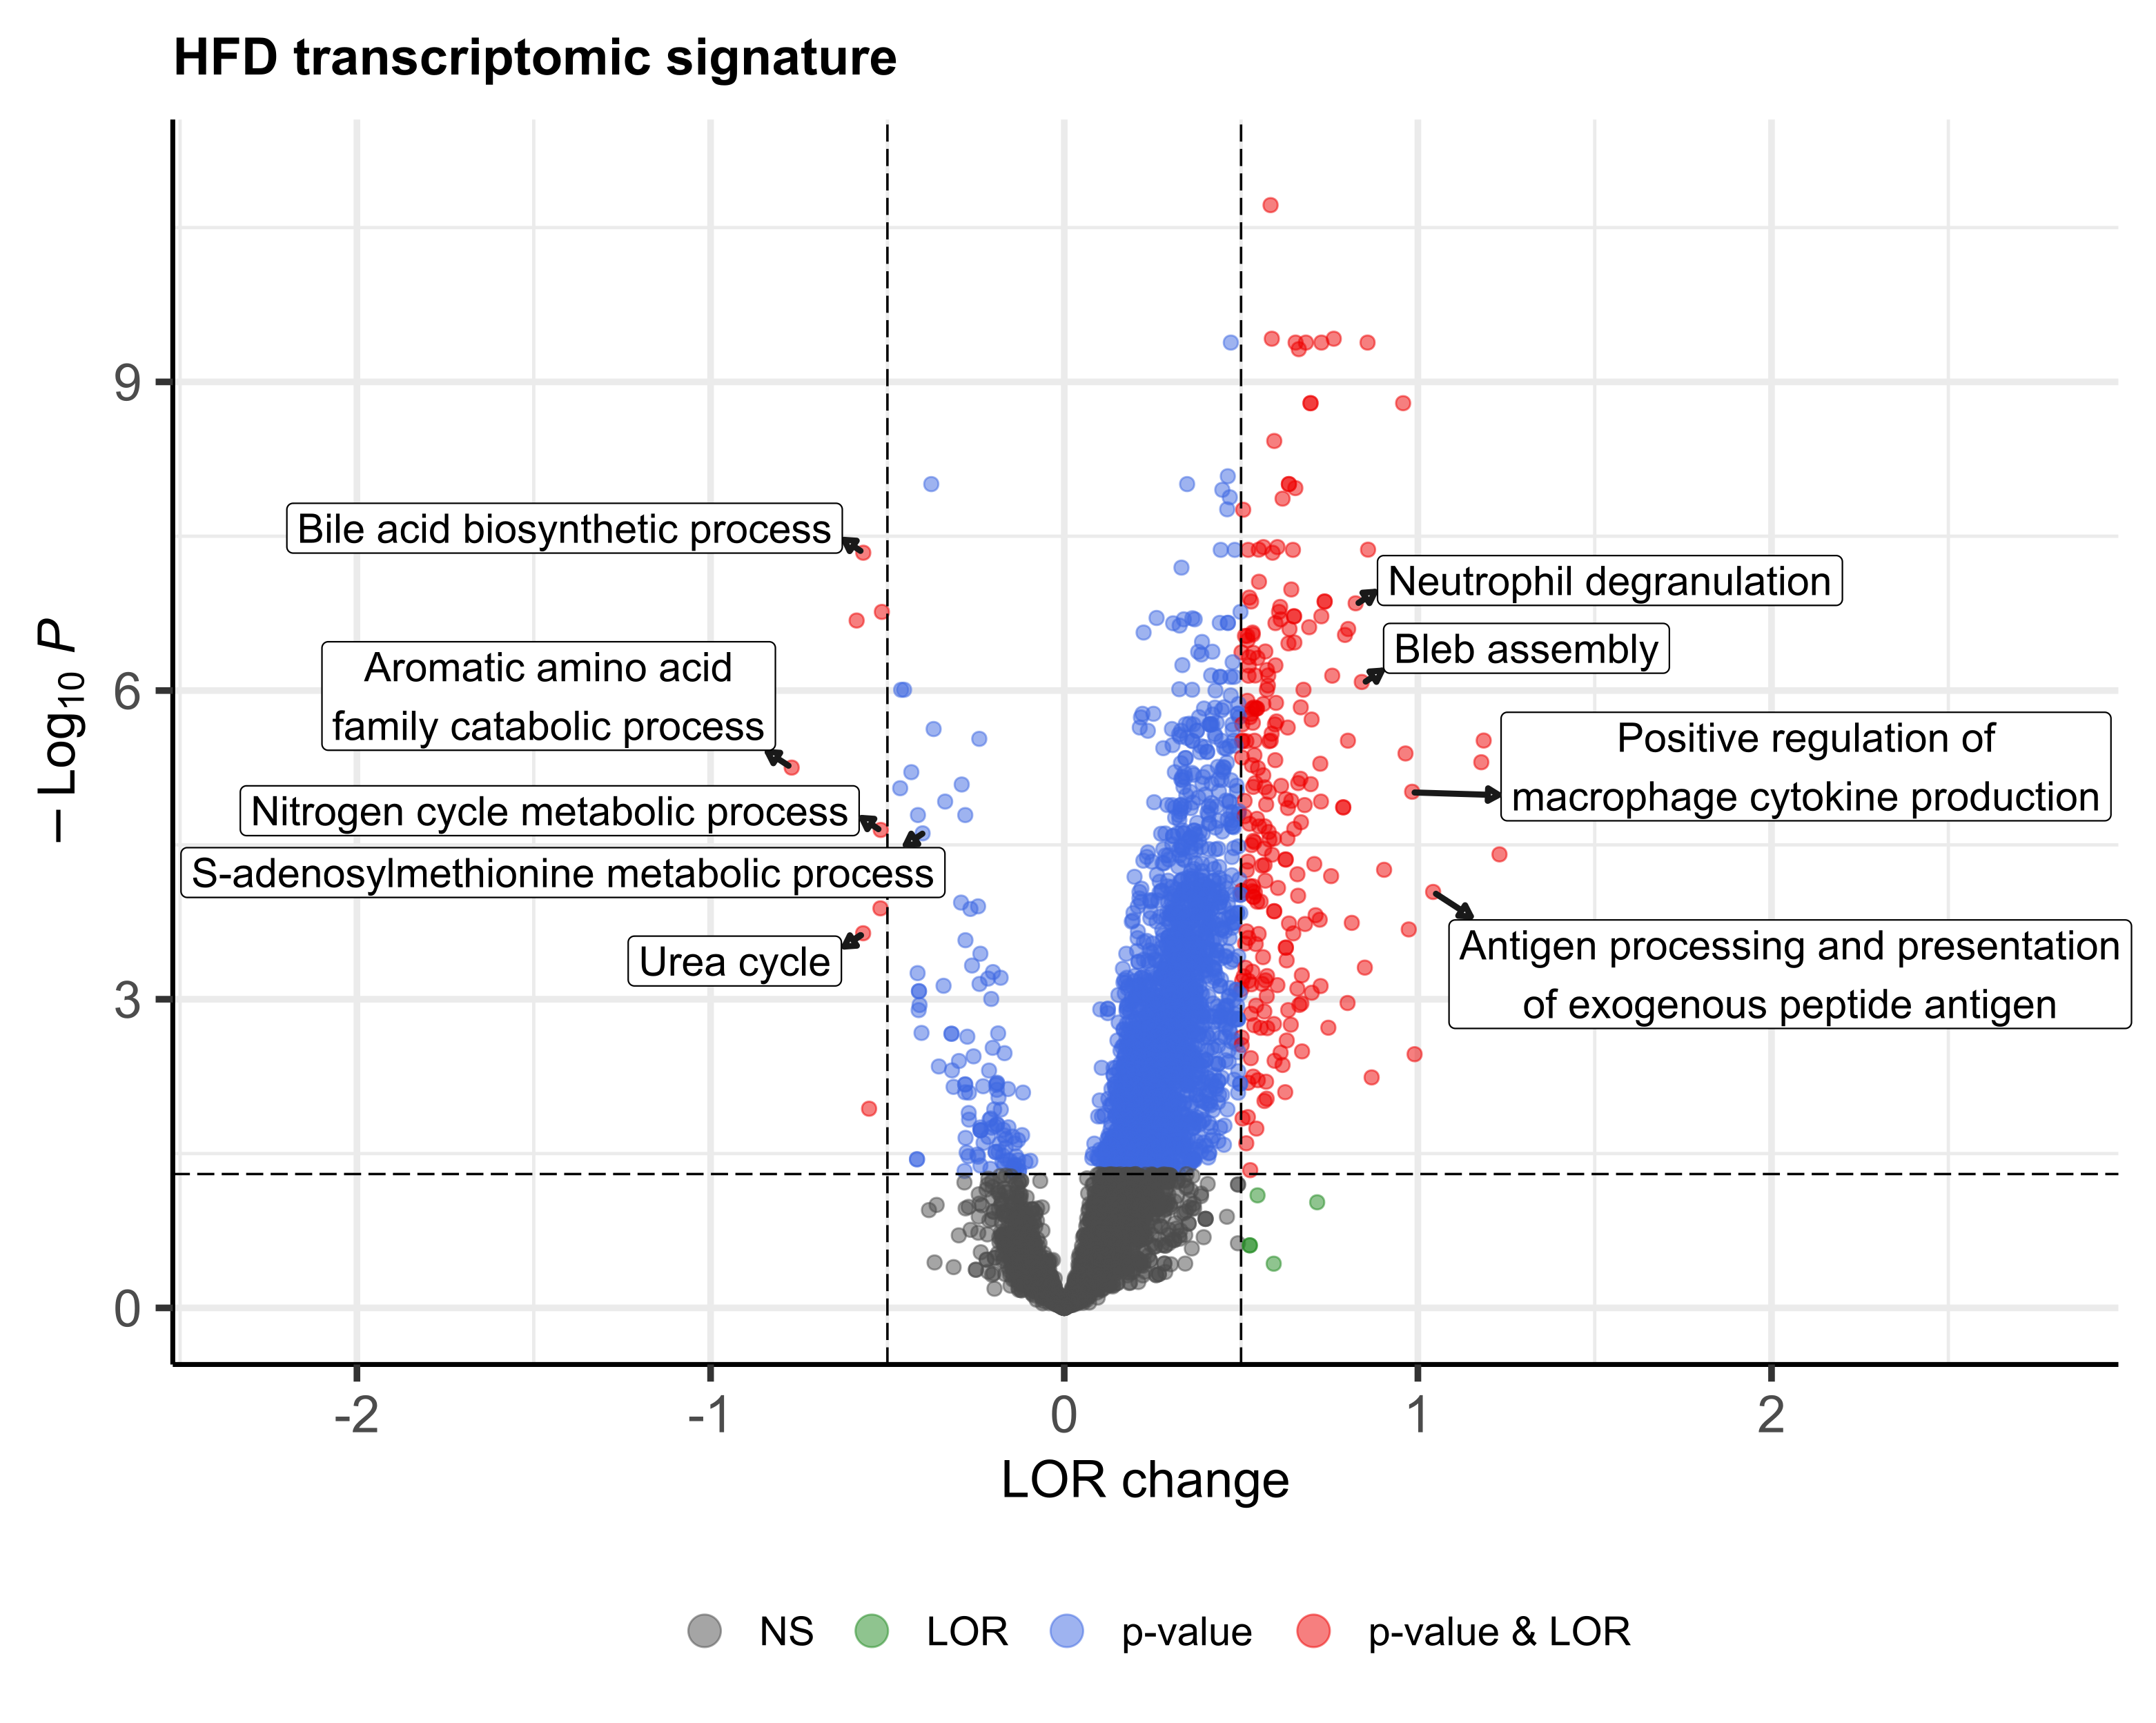
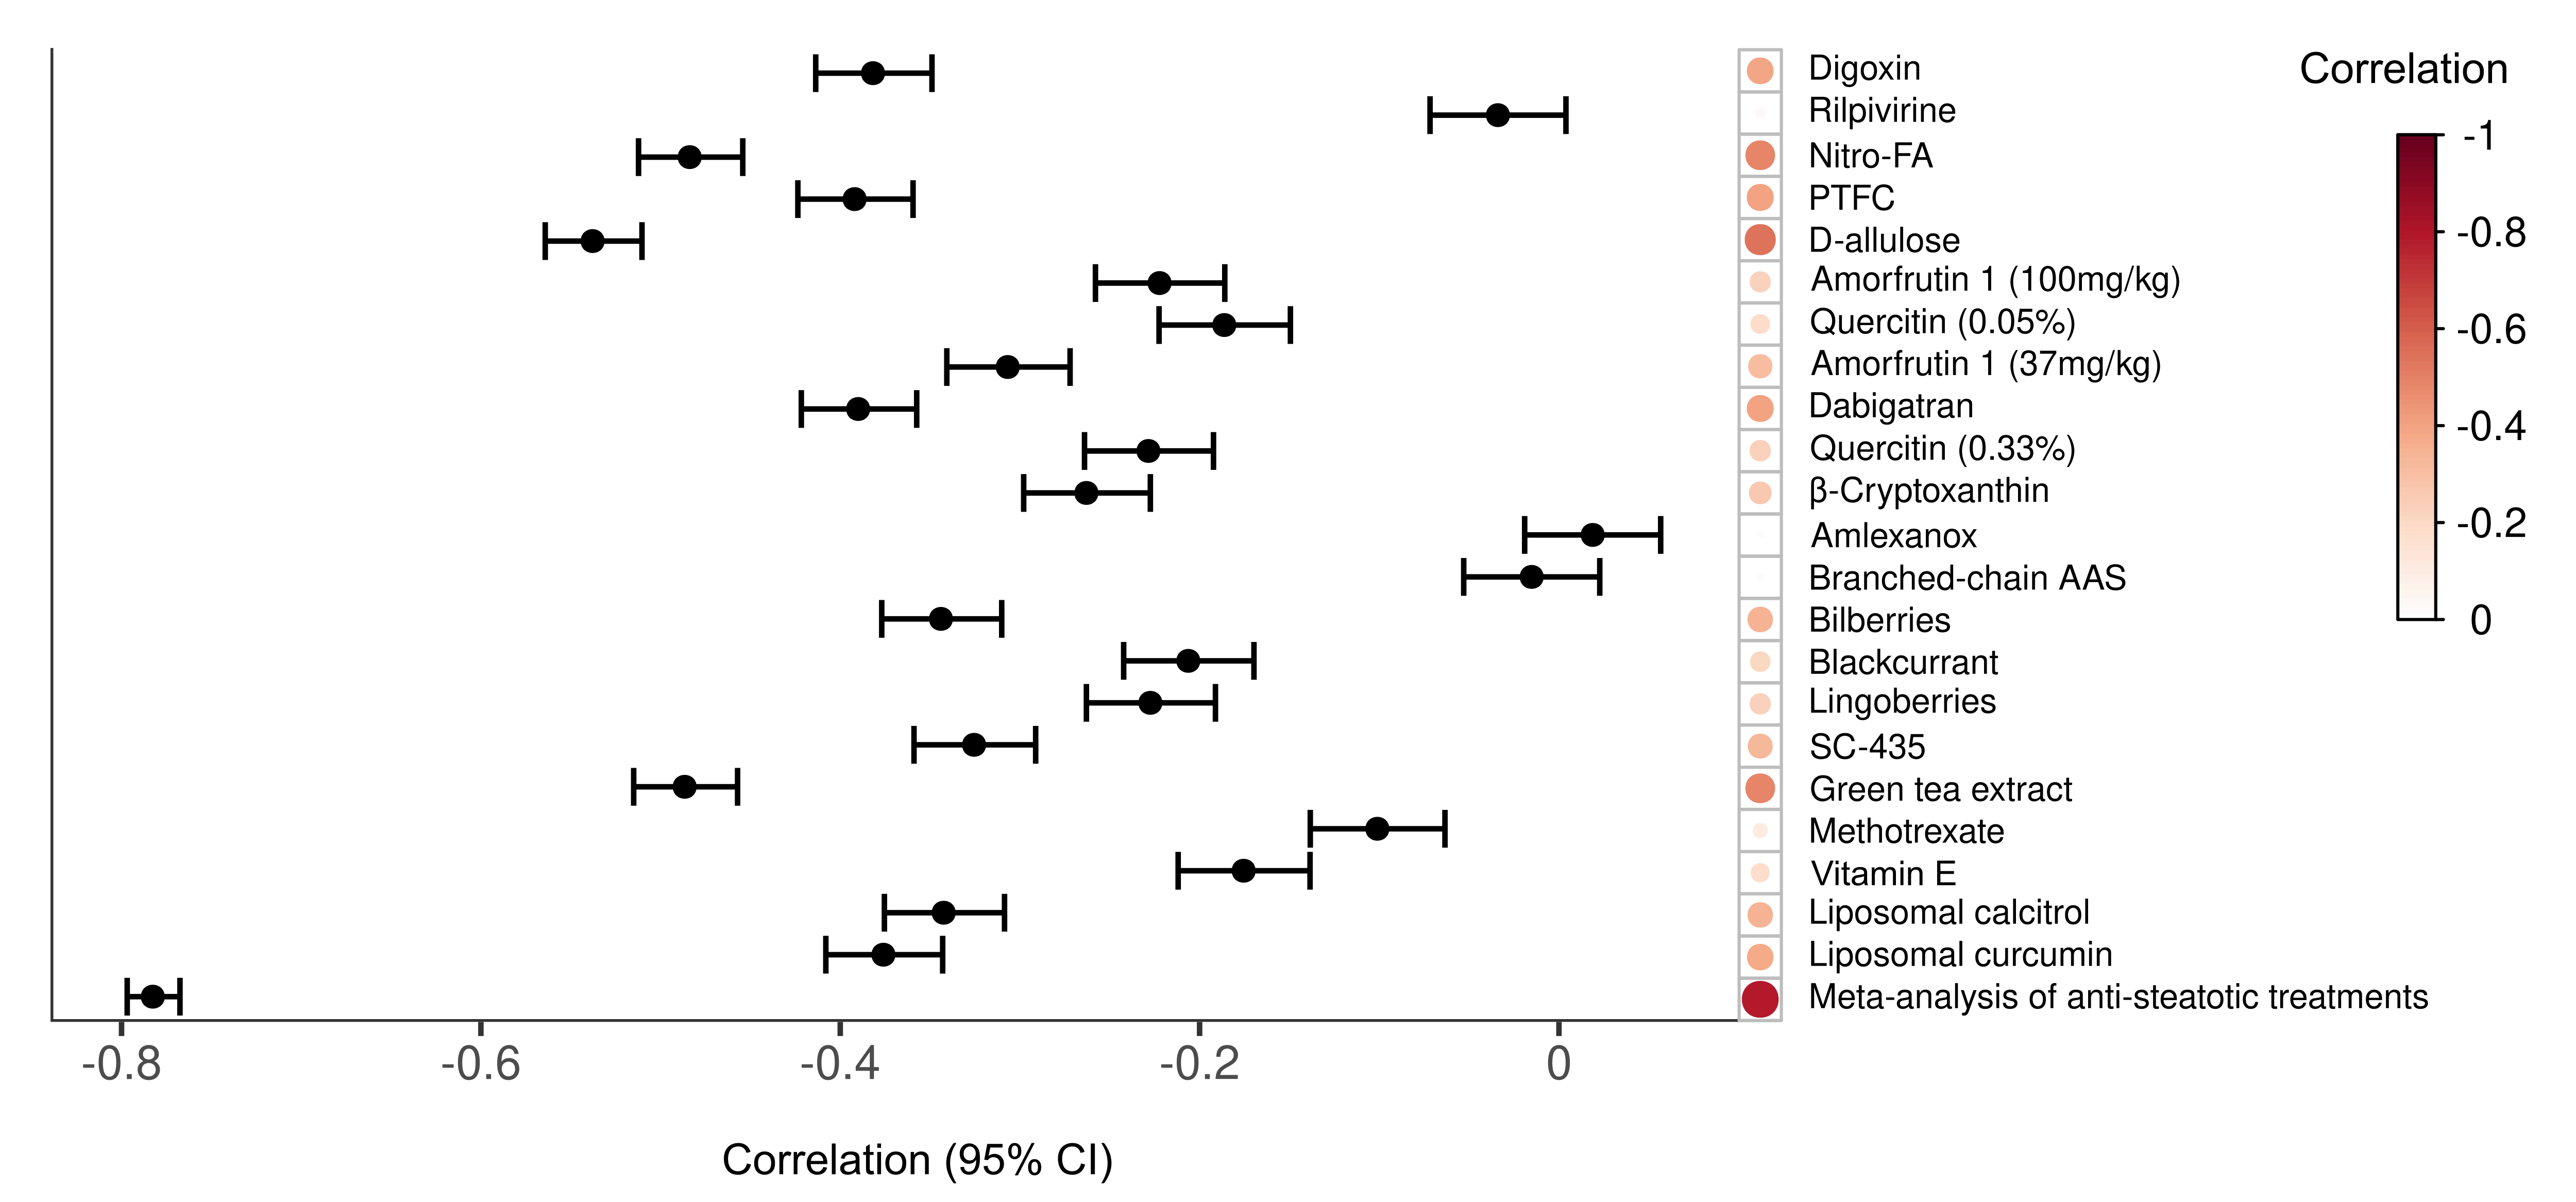
In the systematic review, 21 selected studies were finally analysed, which included 22 different treatments. We obtained a transcriptomic signature of HFD murine models 
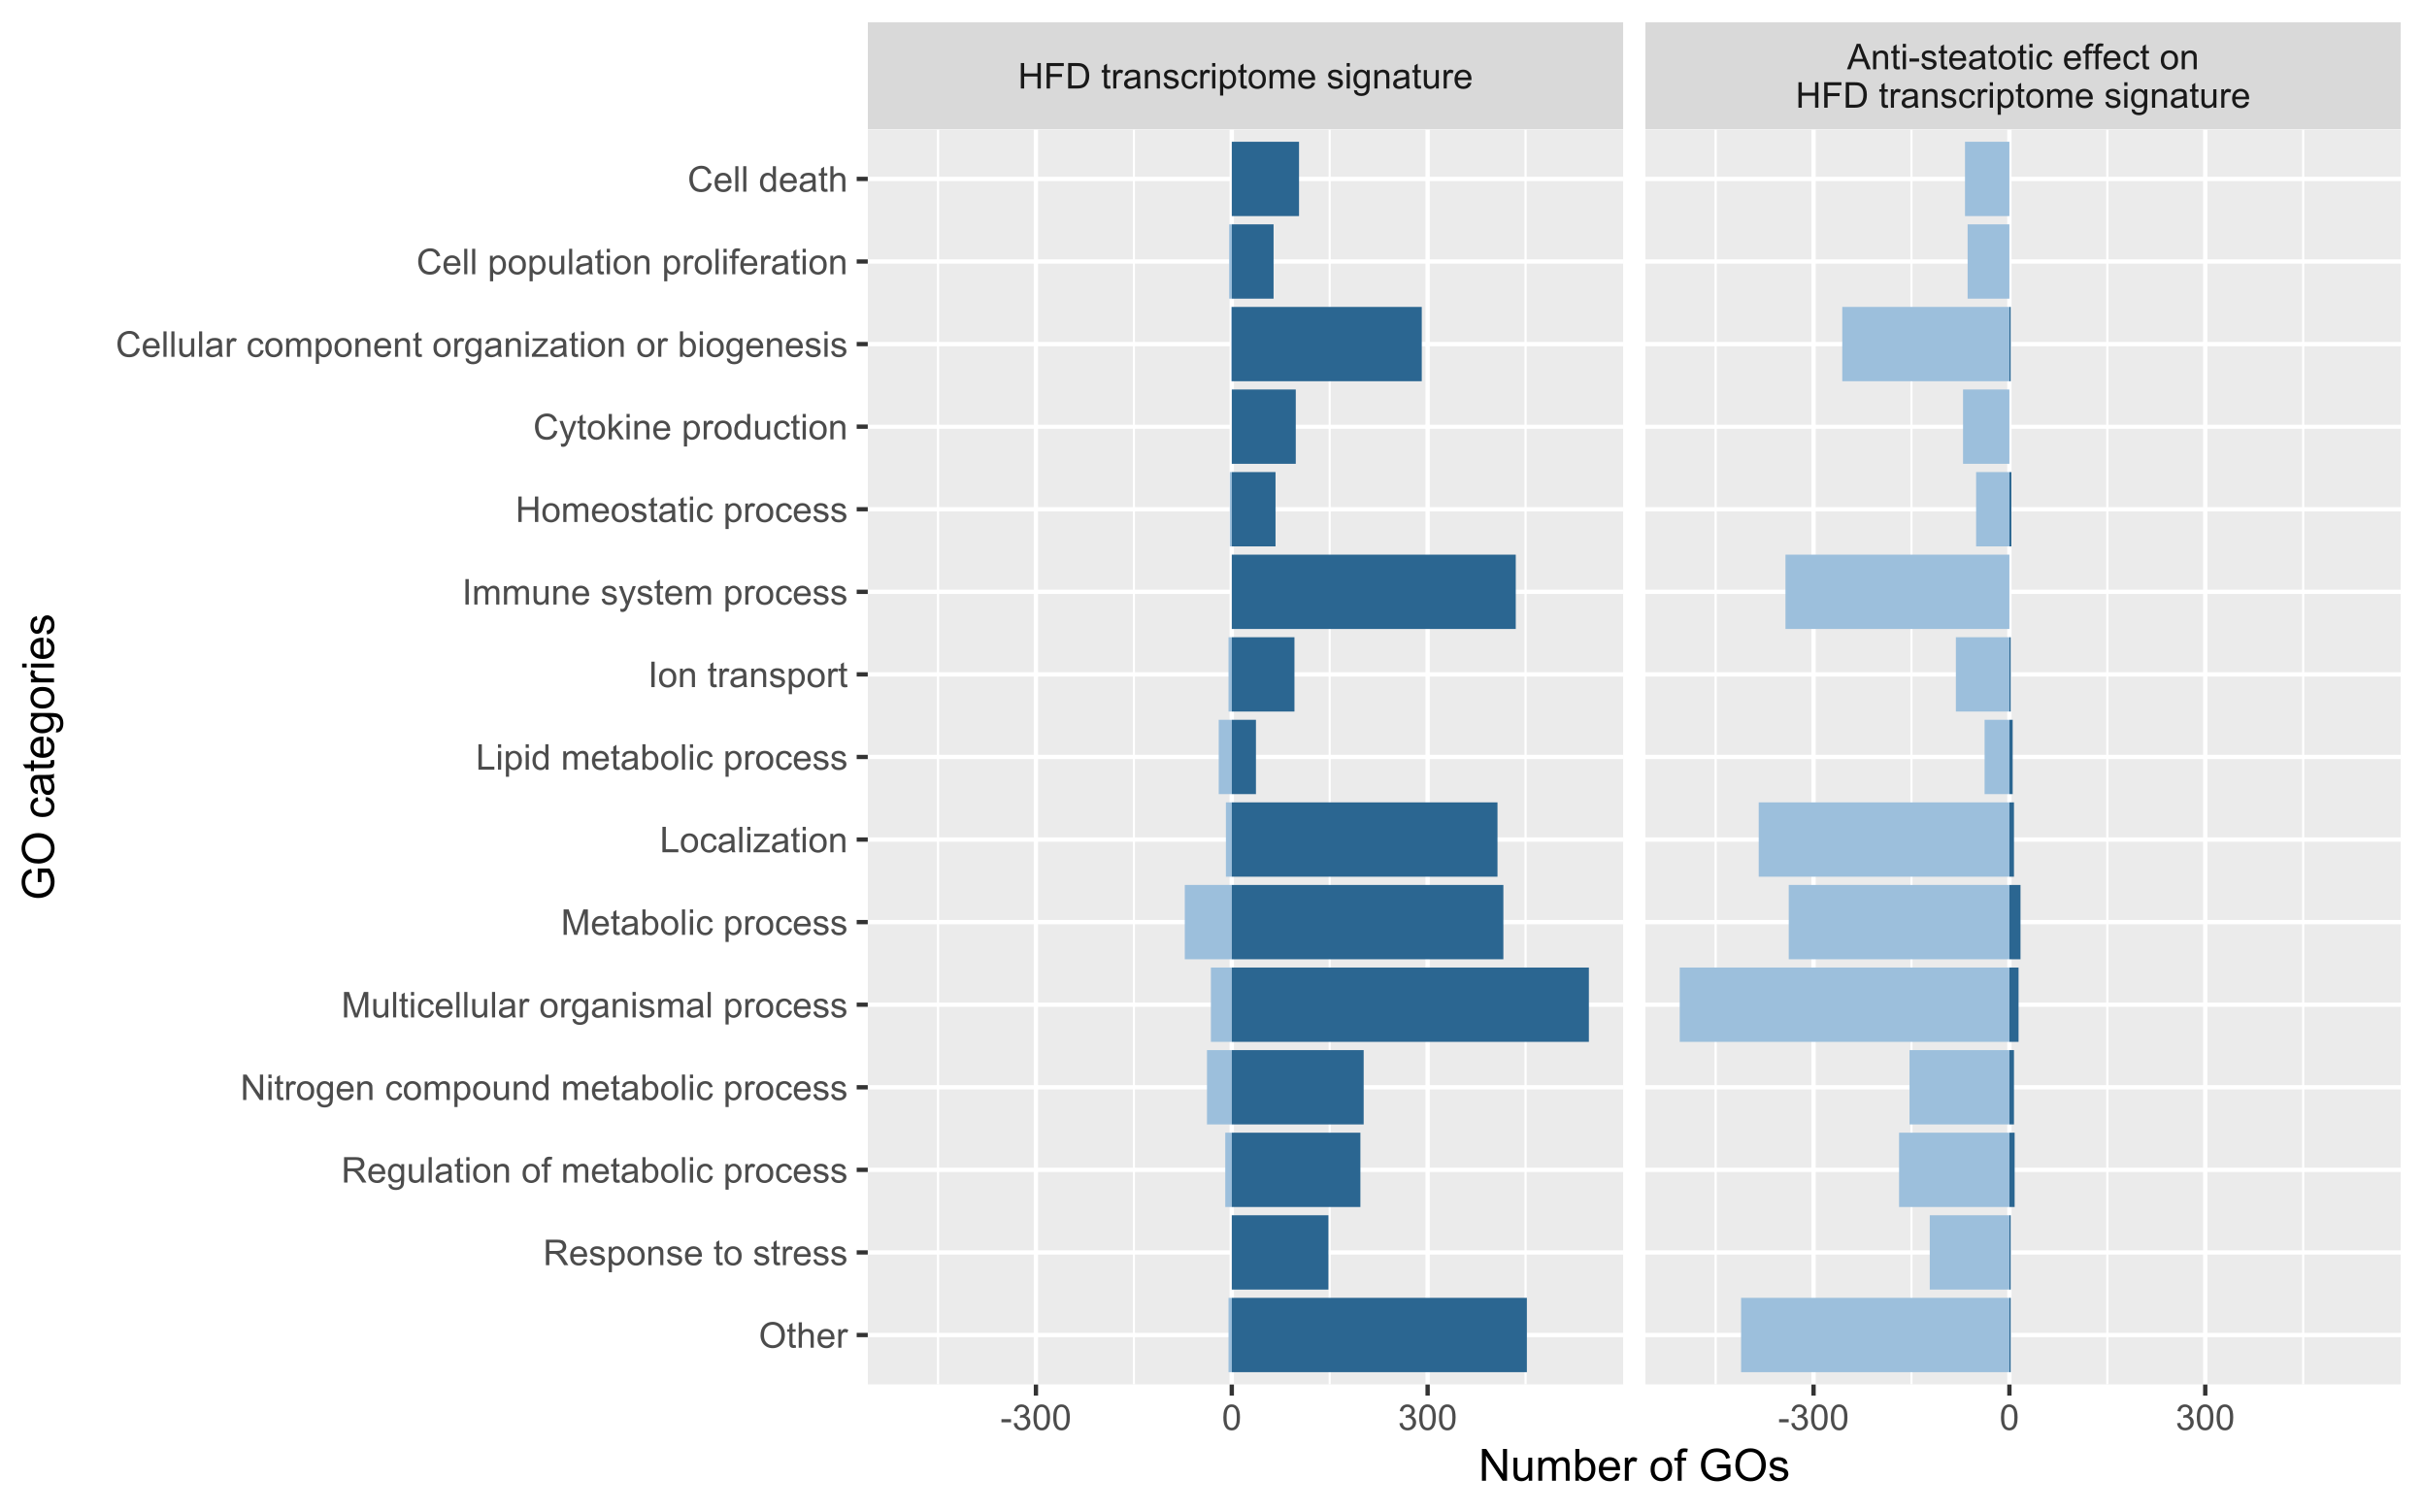
containing 2670 genes and, at the functional level, 2567 GO biological processes altered, most of them involved 
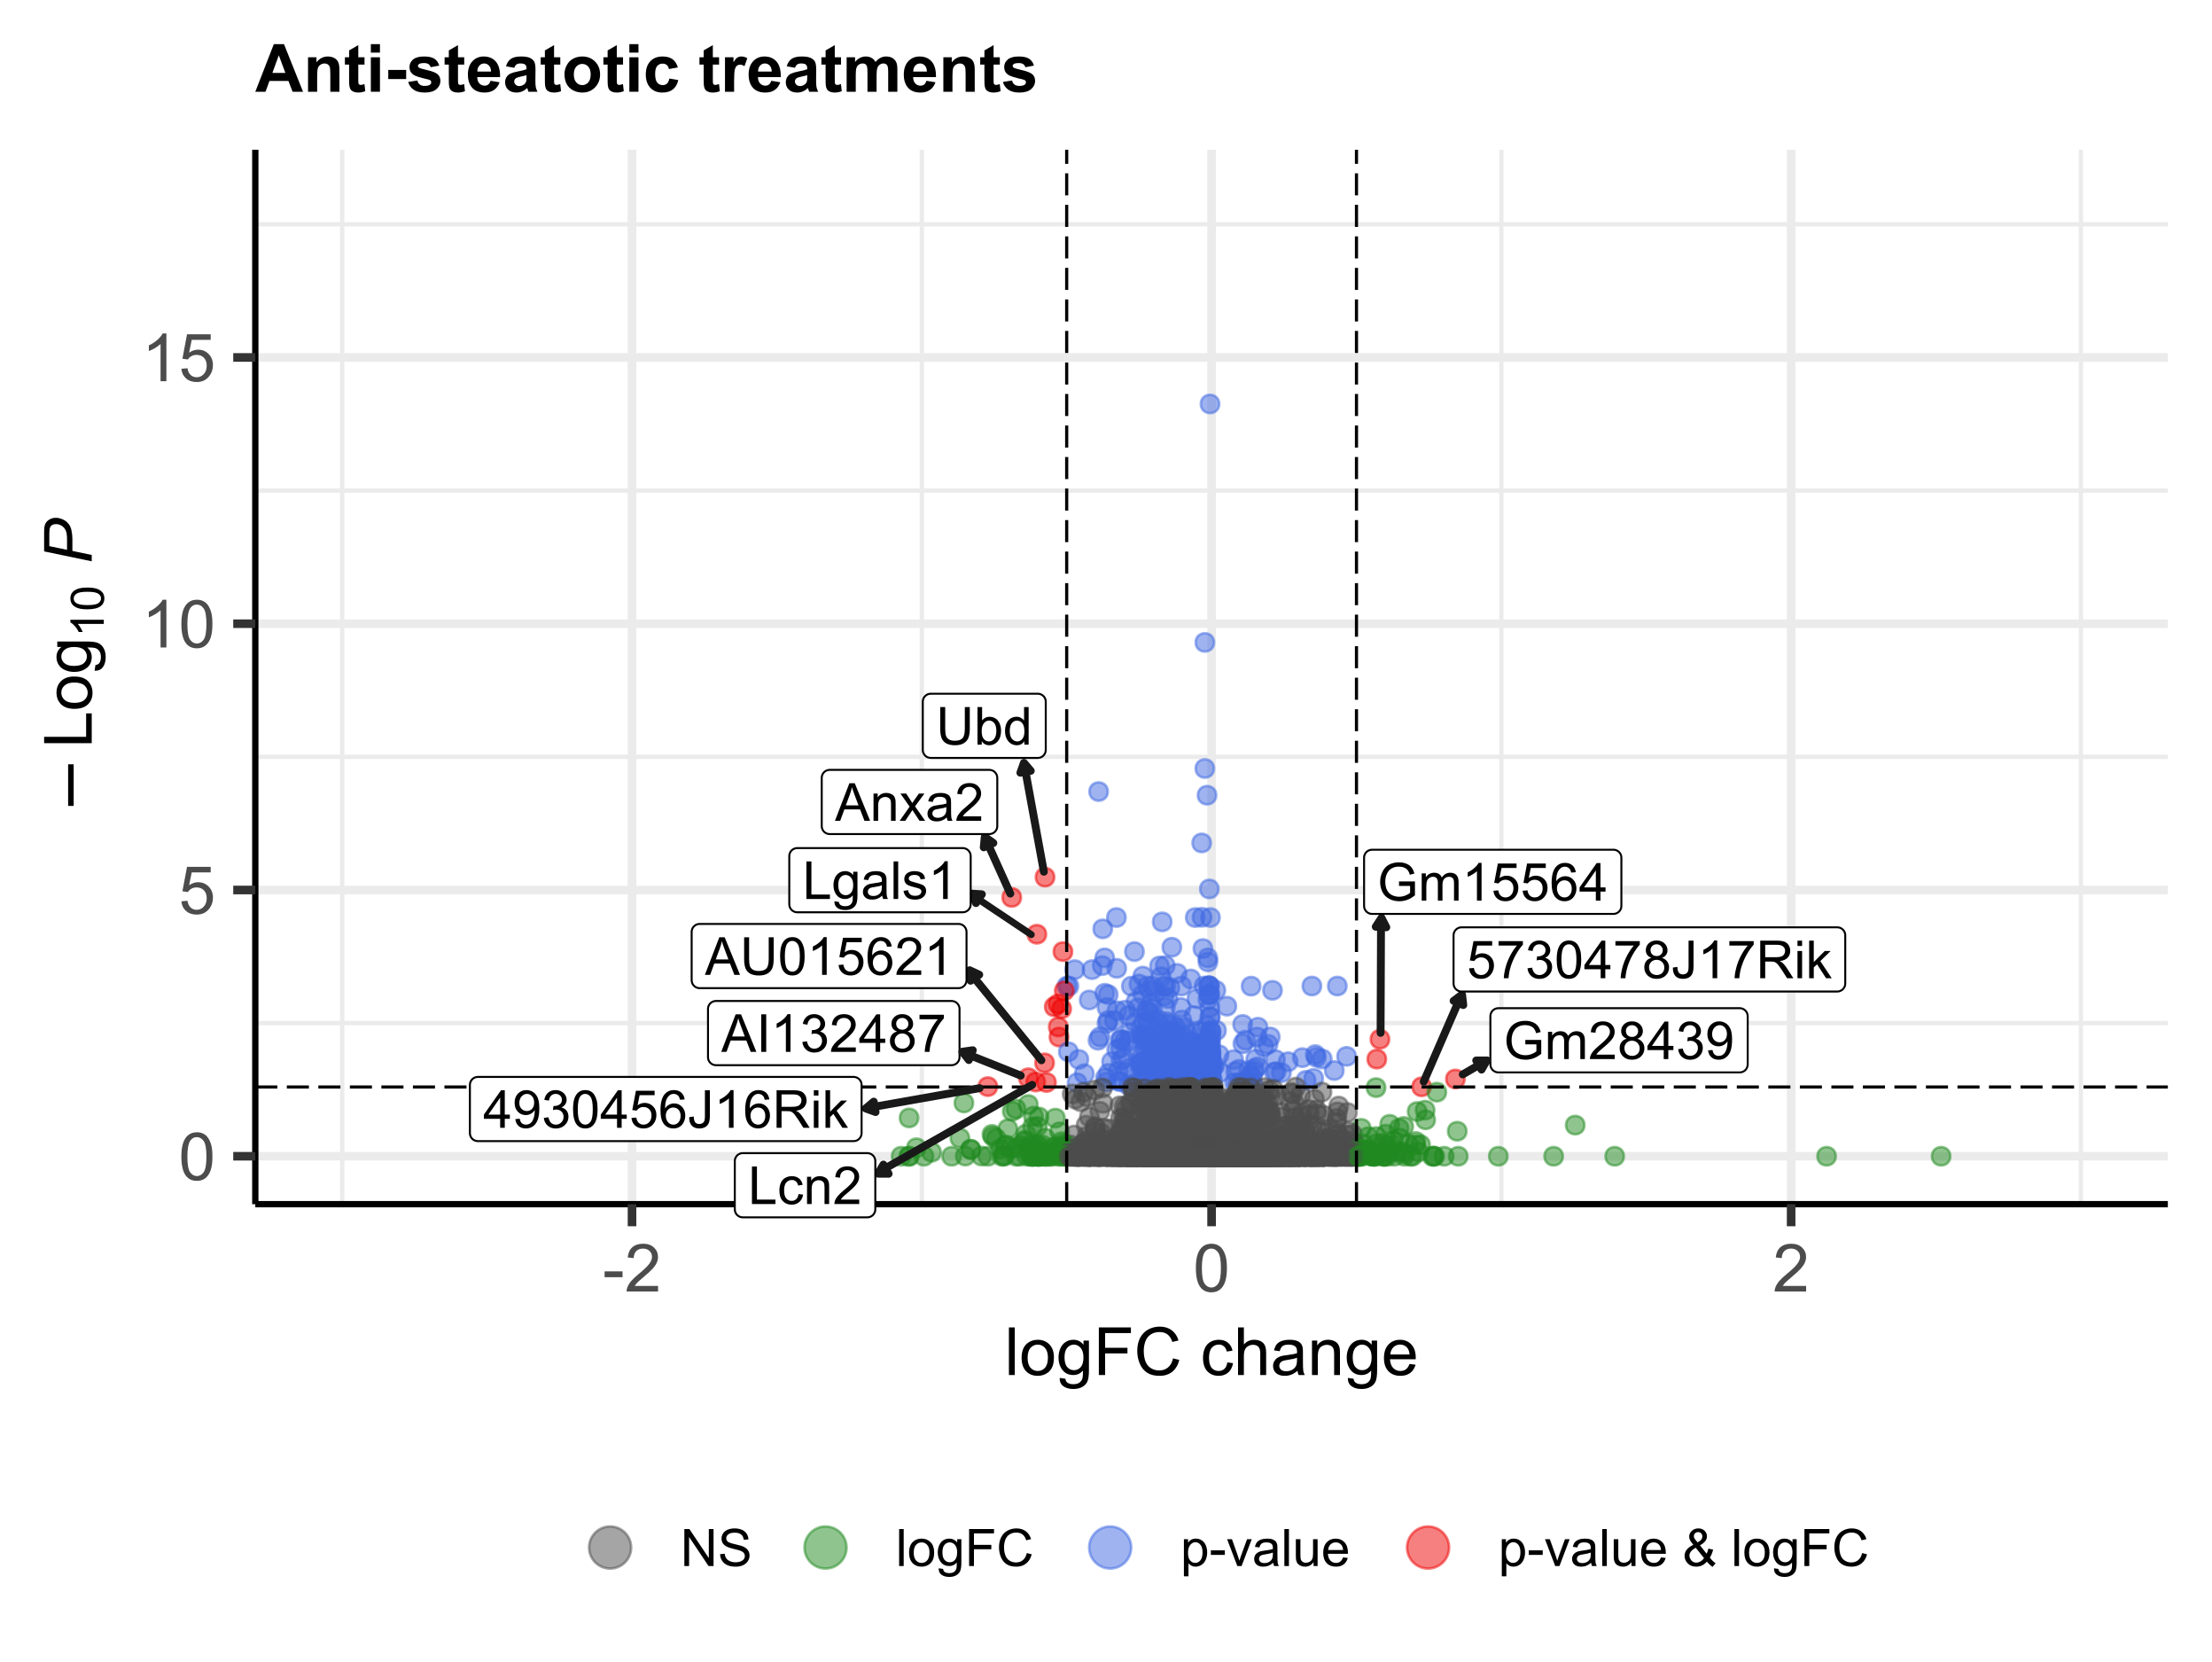
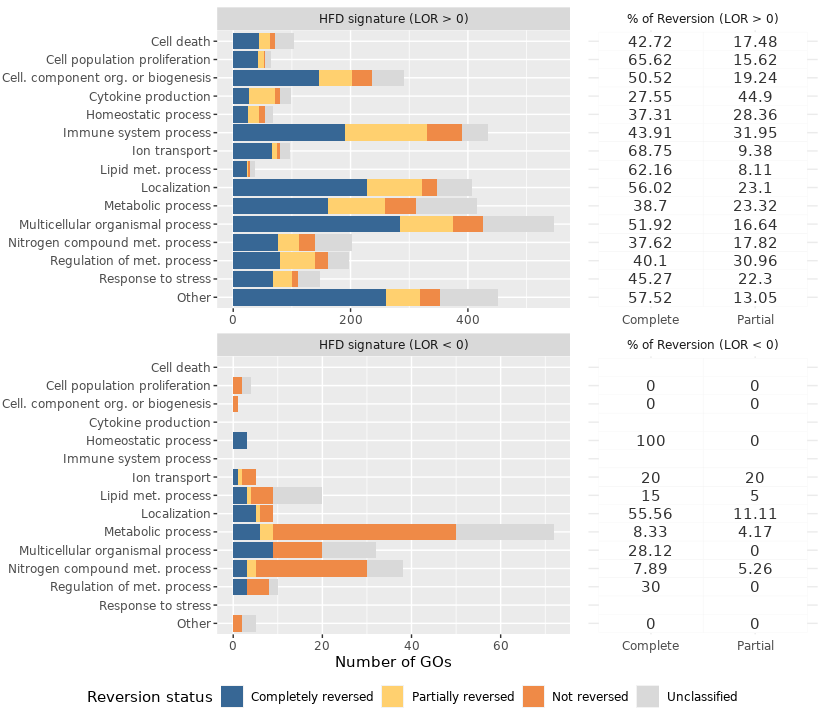
in immune response, cell death, response to stress, cell cycle and metabolism. Generally, treated HFD-mice 
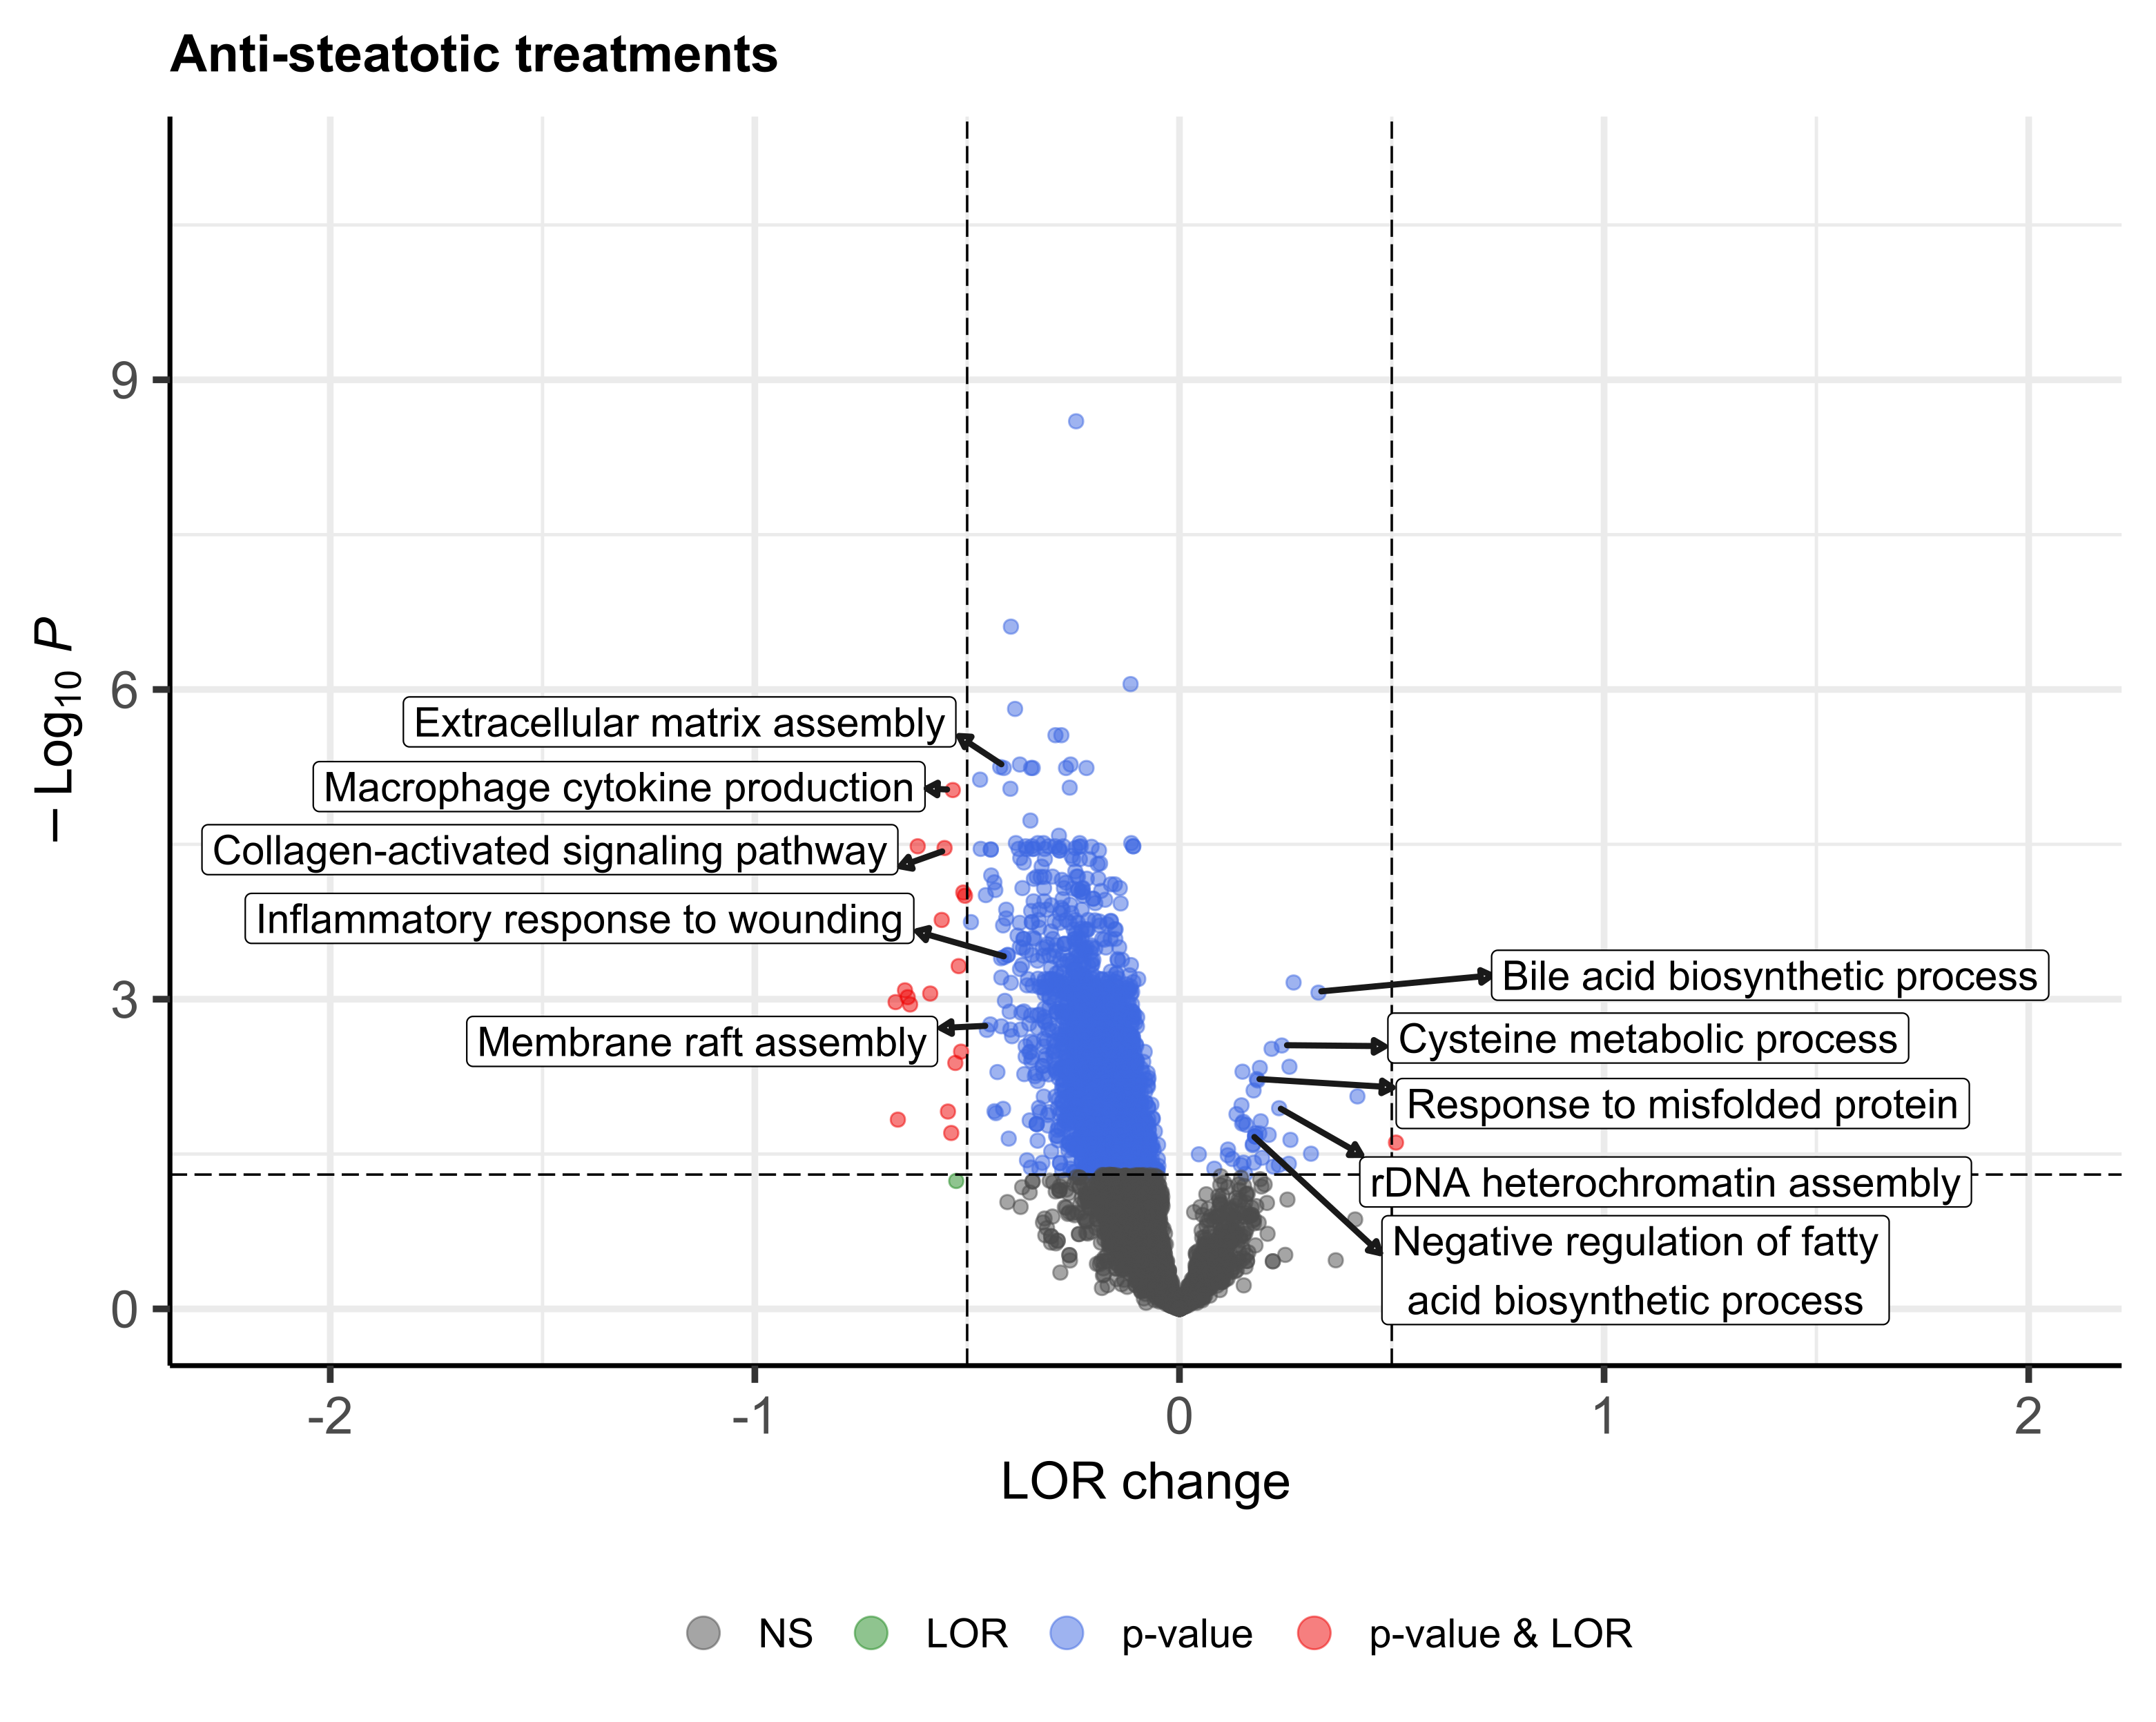
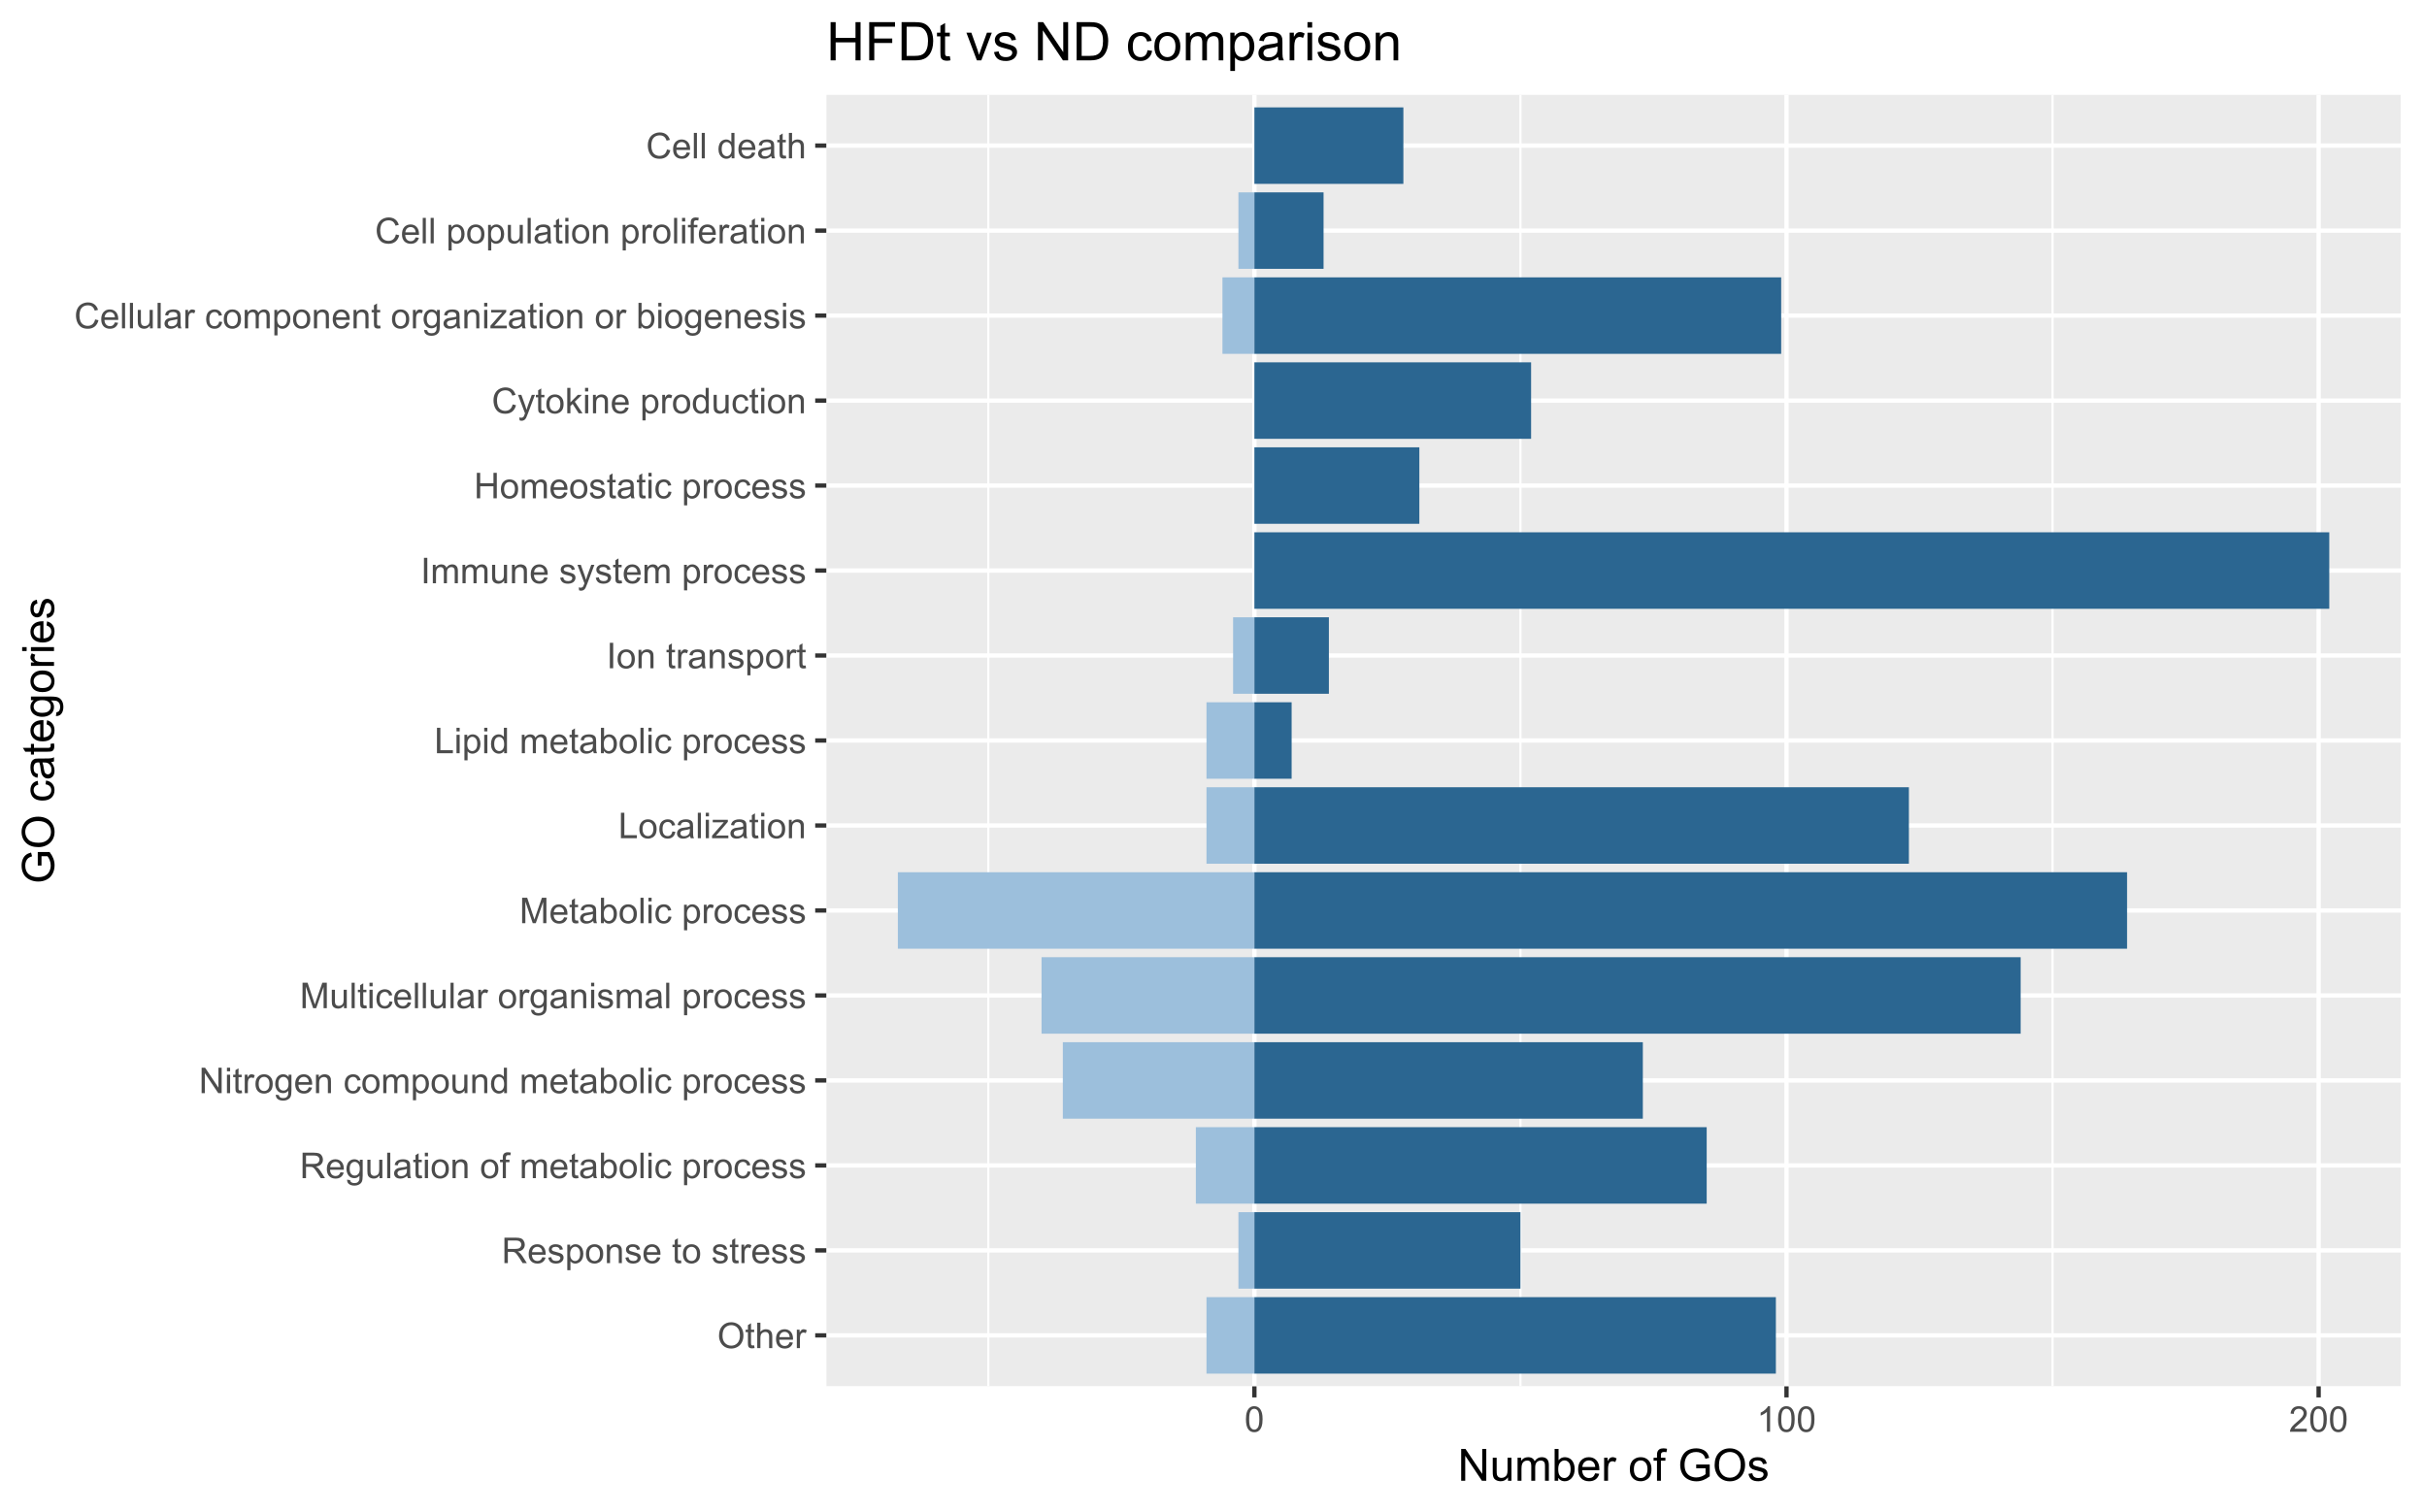
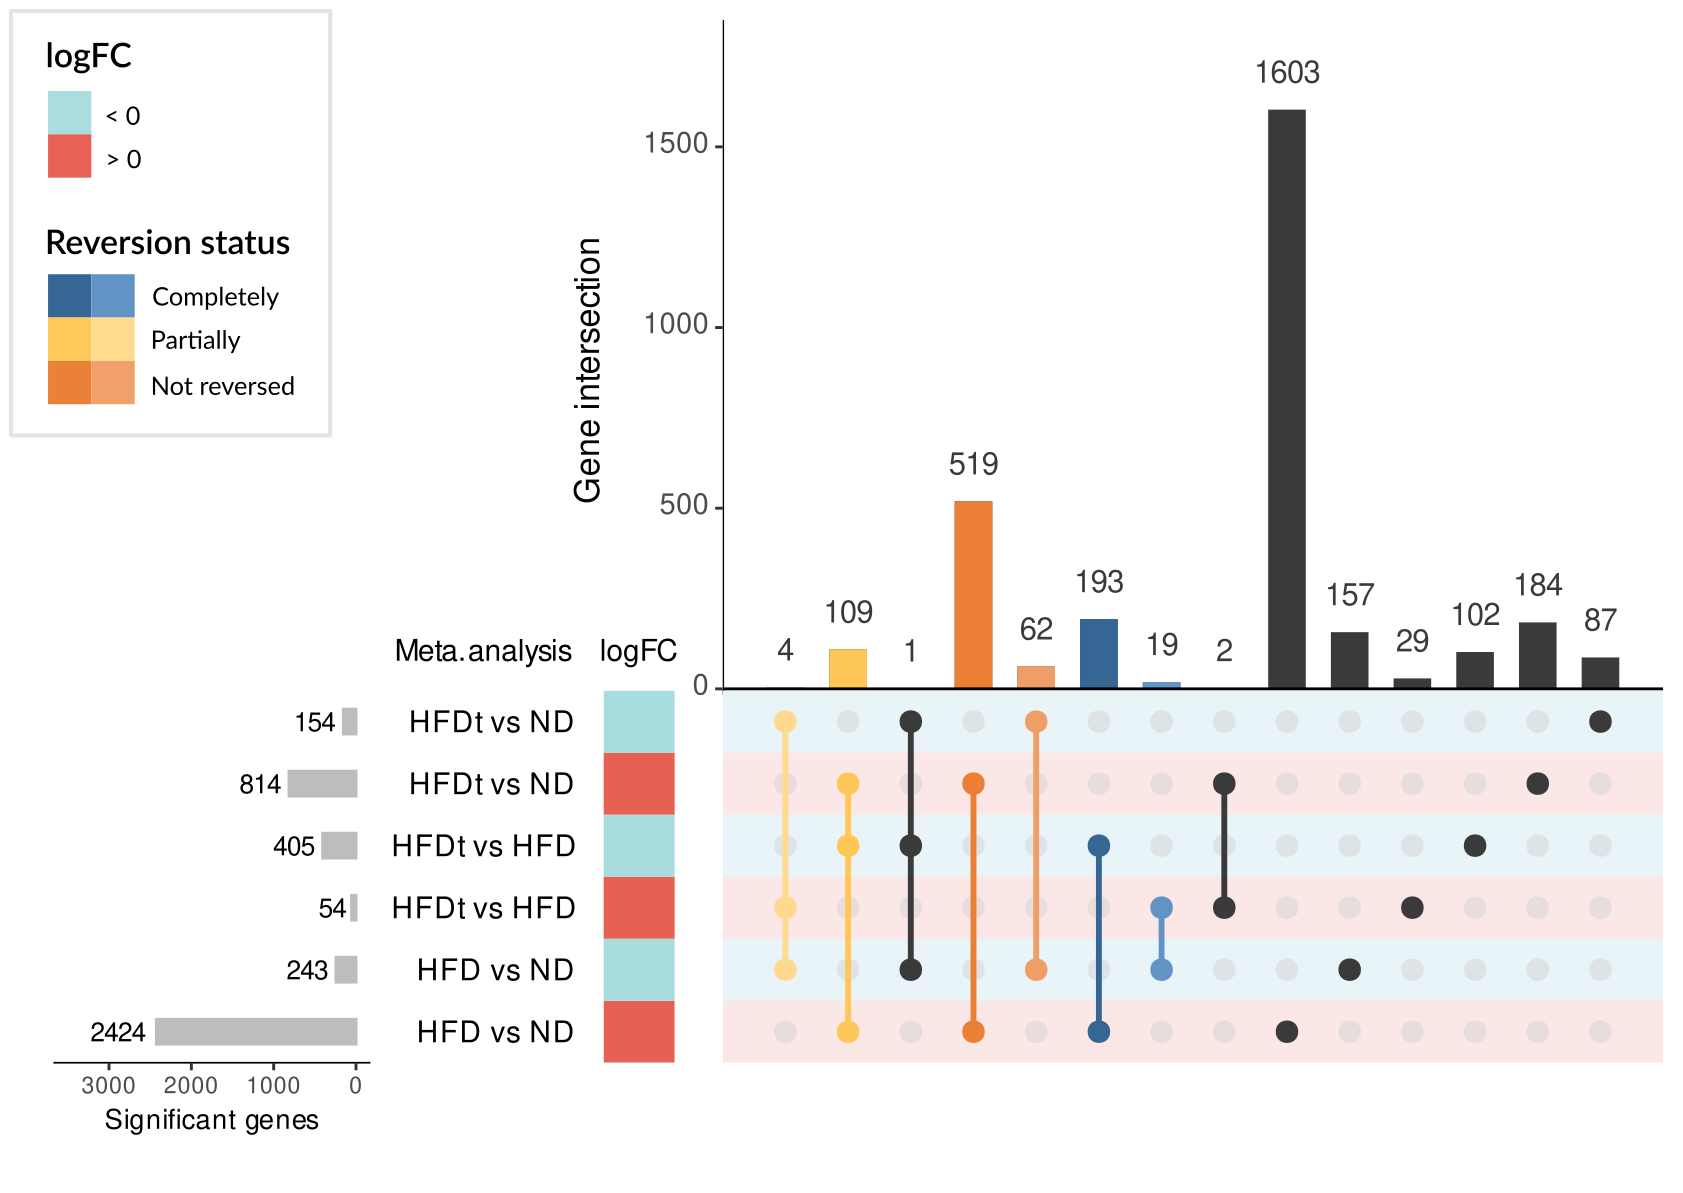
showed a reversion of this HFD signature, although to different extent depending on the treatment. Among the genes of the HFD signature, we identified 325 genes whose expression was commonly reversed by treatments and 
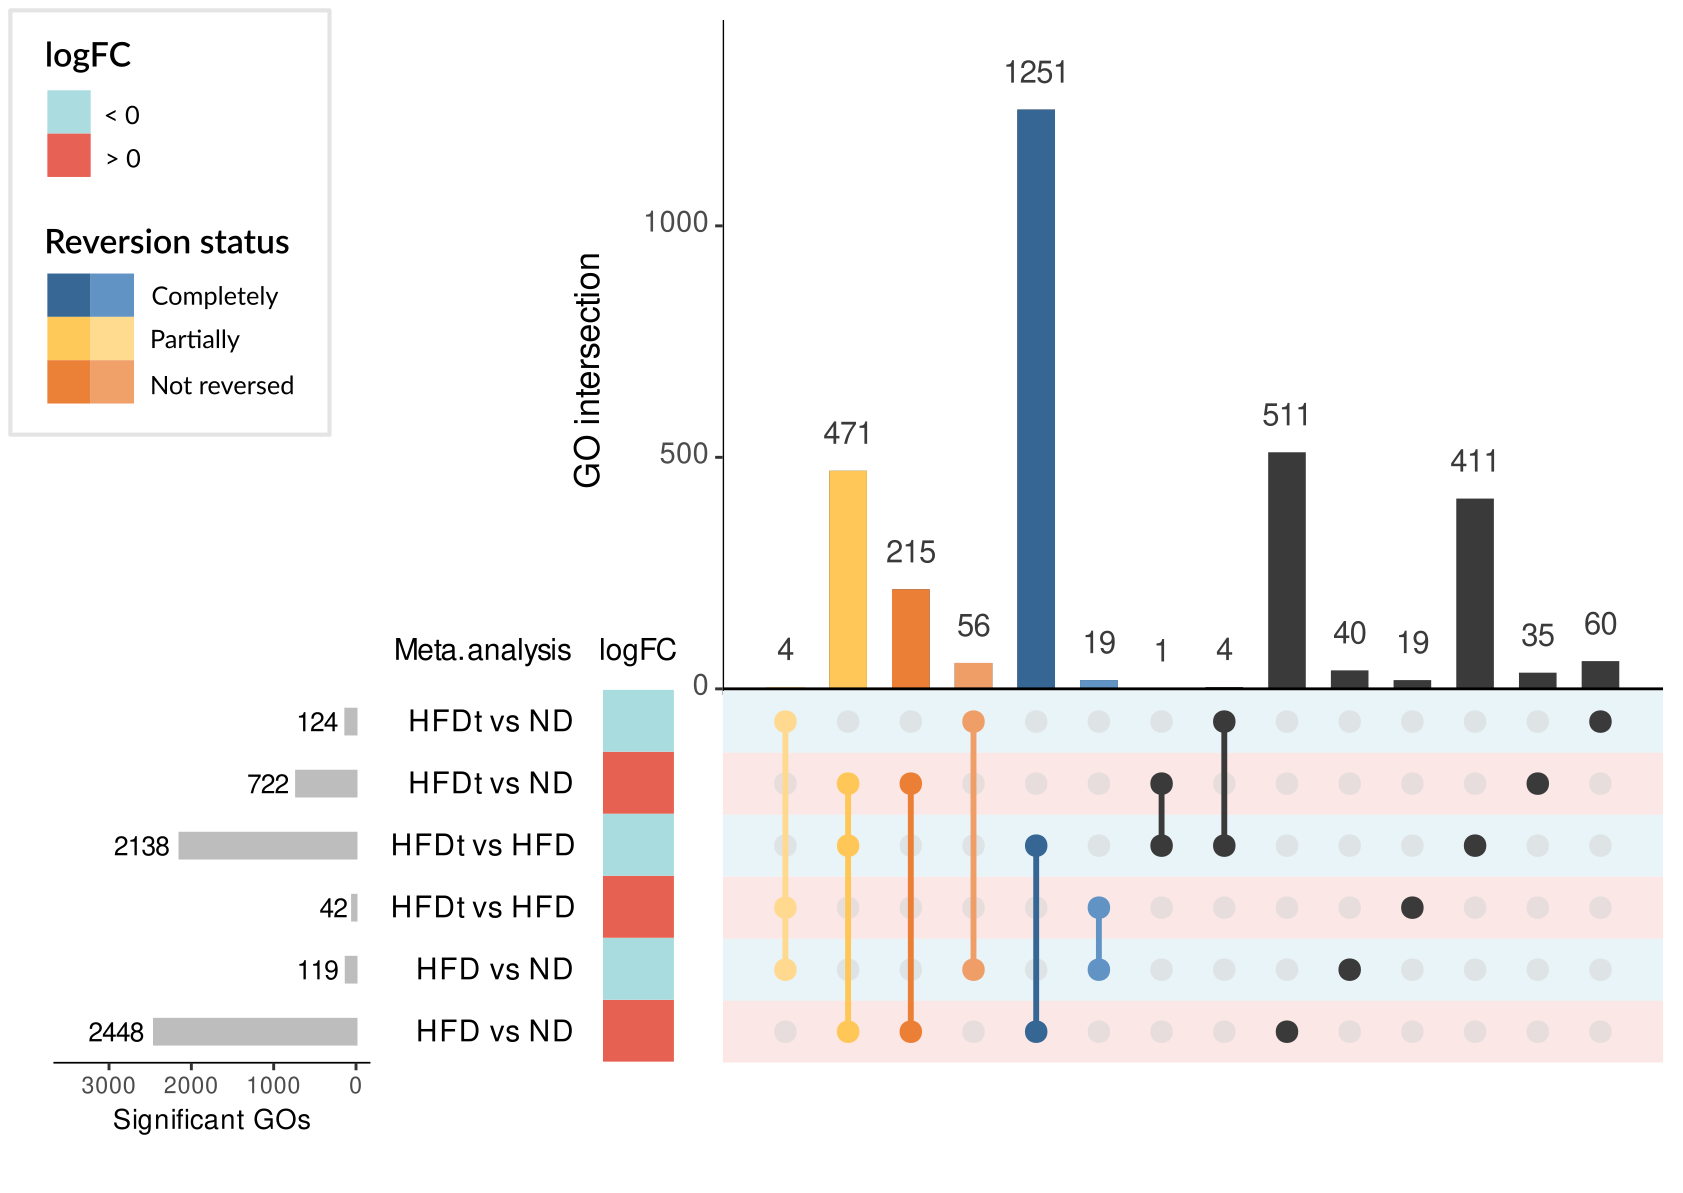
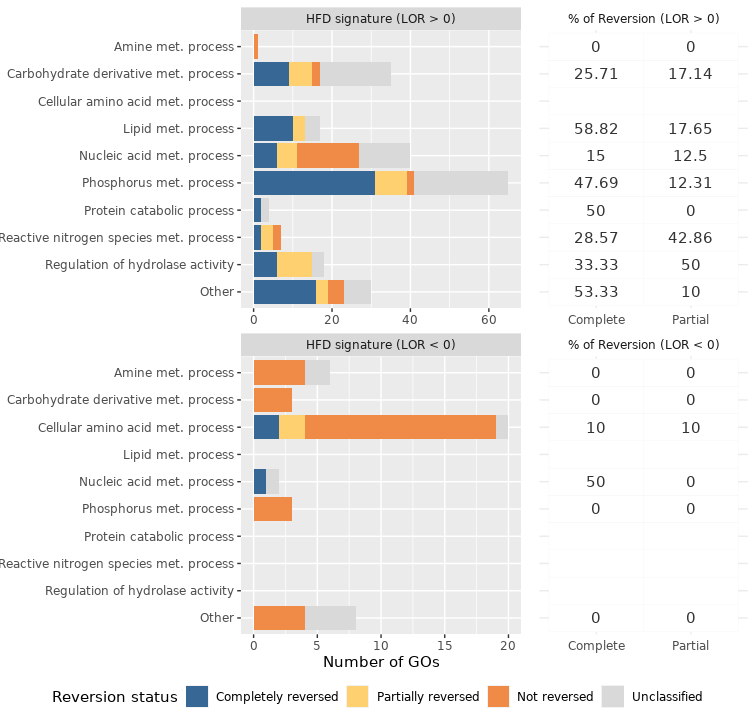
581 whose expression was not reversed. Regarding GO terms of the HFD signature, 1745 were reversed and 271 were not. The biological processes most frequently reversed were those related to lipid metabolism, cell death, cell proliferation, response to stress and immune system process. Conversely, processes related to nitrogen compound metabolism were usually not reversed. Comparing our HFD signature with a human NAFLD progression signature, we identified 62 common genes: 10 of them were of those generally reversed by treatments and 12 belong to the not reversed group.


PRISMA diagram: Flow diagram of the systematic review of the literature and selection of studies for meta-analysis.


Volcano plots showing alterations in gene expression detected in the different comparisons performed in the meta-analysis. Left) Volcano plot showing the results from the HFD vs ND comparison. Right) Volcano plot showing the results from the HFDt vs HFD comparison. Blue dots represent genes whose expression was significantly altered (FDR < 0.05), red dots are those significantly changed (FDR < 0.05) and with a logFC > 0.5 or logFC < 0.5 and, finally, green dots represent genes whose expression changed with a logFC > 0.5 or logFC < 0.5, but this change is not statistically significant. Dots with an absolute value of logFC greater than 3 are not displayed.


Volcano plots showing alterations in functions detected in the different comparisons performed in the meta-analysis. Left) Volcano plot showing the results from the HFD vs ND comparison. Right) Volcano plot showing the results from the HFDt vs HFD comparison. Blue dots represent genes whose expression was significantly altered (FDR < 0.05), red dots are those significantly changed (FDR < 0.05) and with a logFC > 0.5 or logFC < 0.5 and, finally, green dots represent genes whose expression changed with a logFC > 0.5 or logFC < 0.5, but this change is not statistically significant. Dots with an absolute value of logFC greater than 3 are not displayed.

ND vs. HFD & HFD vs. HFDt


Number of significantly altered GO terms in the HFD transcriptome signature (HFD vs ND) and the effect of anti-steatotic therapies (HFDt vs ND) grouped by GO categories following the hierarchical structure of the GO database. Upregulated and downregulated GO terms are shownin dark and light blue, respectively.

ND vs. HFDt


Number of significantly altered GO terms in the HFDt vs ND meta-analysis, grouped by GO categories following the hierarchical structure of the GO database. The GO terms marked in dark blue are upregulated and those in light blue are downregulated.


Correlation plot of the HFD transcriptomic signature against each of the differential expression analyses of the anti-steatotic treatments and the meta-analysis of the anti-steatotic effect. Correlation coefficients and their confidence intervals are shown for each correlation: HFD transcriptomic signature (HFD vs ND comparison from the meta-analysis) against each of the differential expression analyses of the various anti-steatotic treatments employed in the selected studies, as well as against the anti-steatotic effect signature (HFDt vs HFD comparison from the meta-analysis). The size and color intensity of the dots are proportional to correlation’s coefficient. Two treatments were discarded for this analysis due to their low number of significant results.


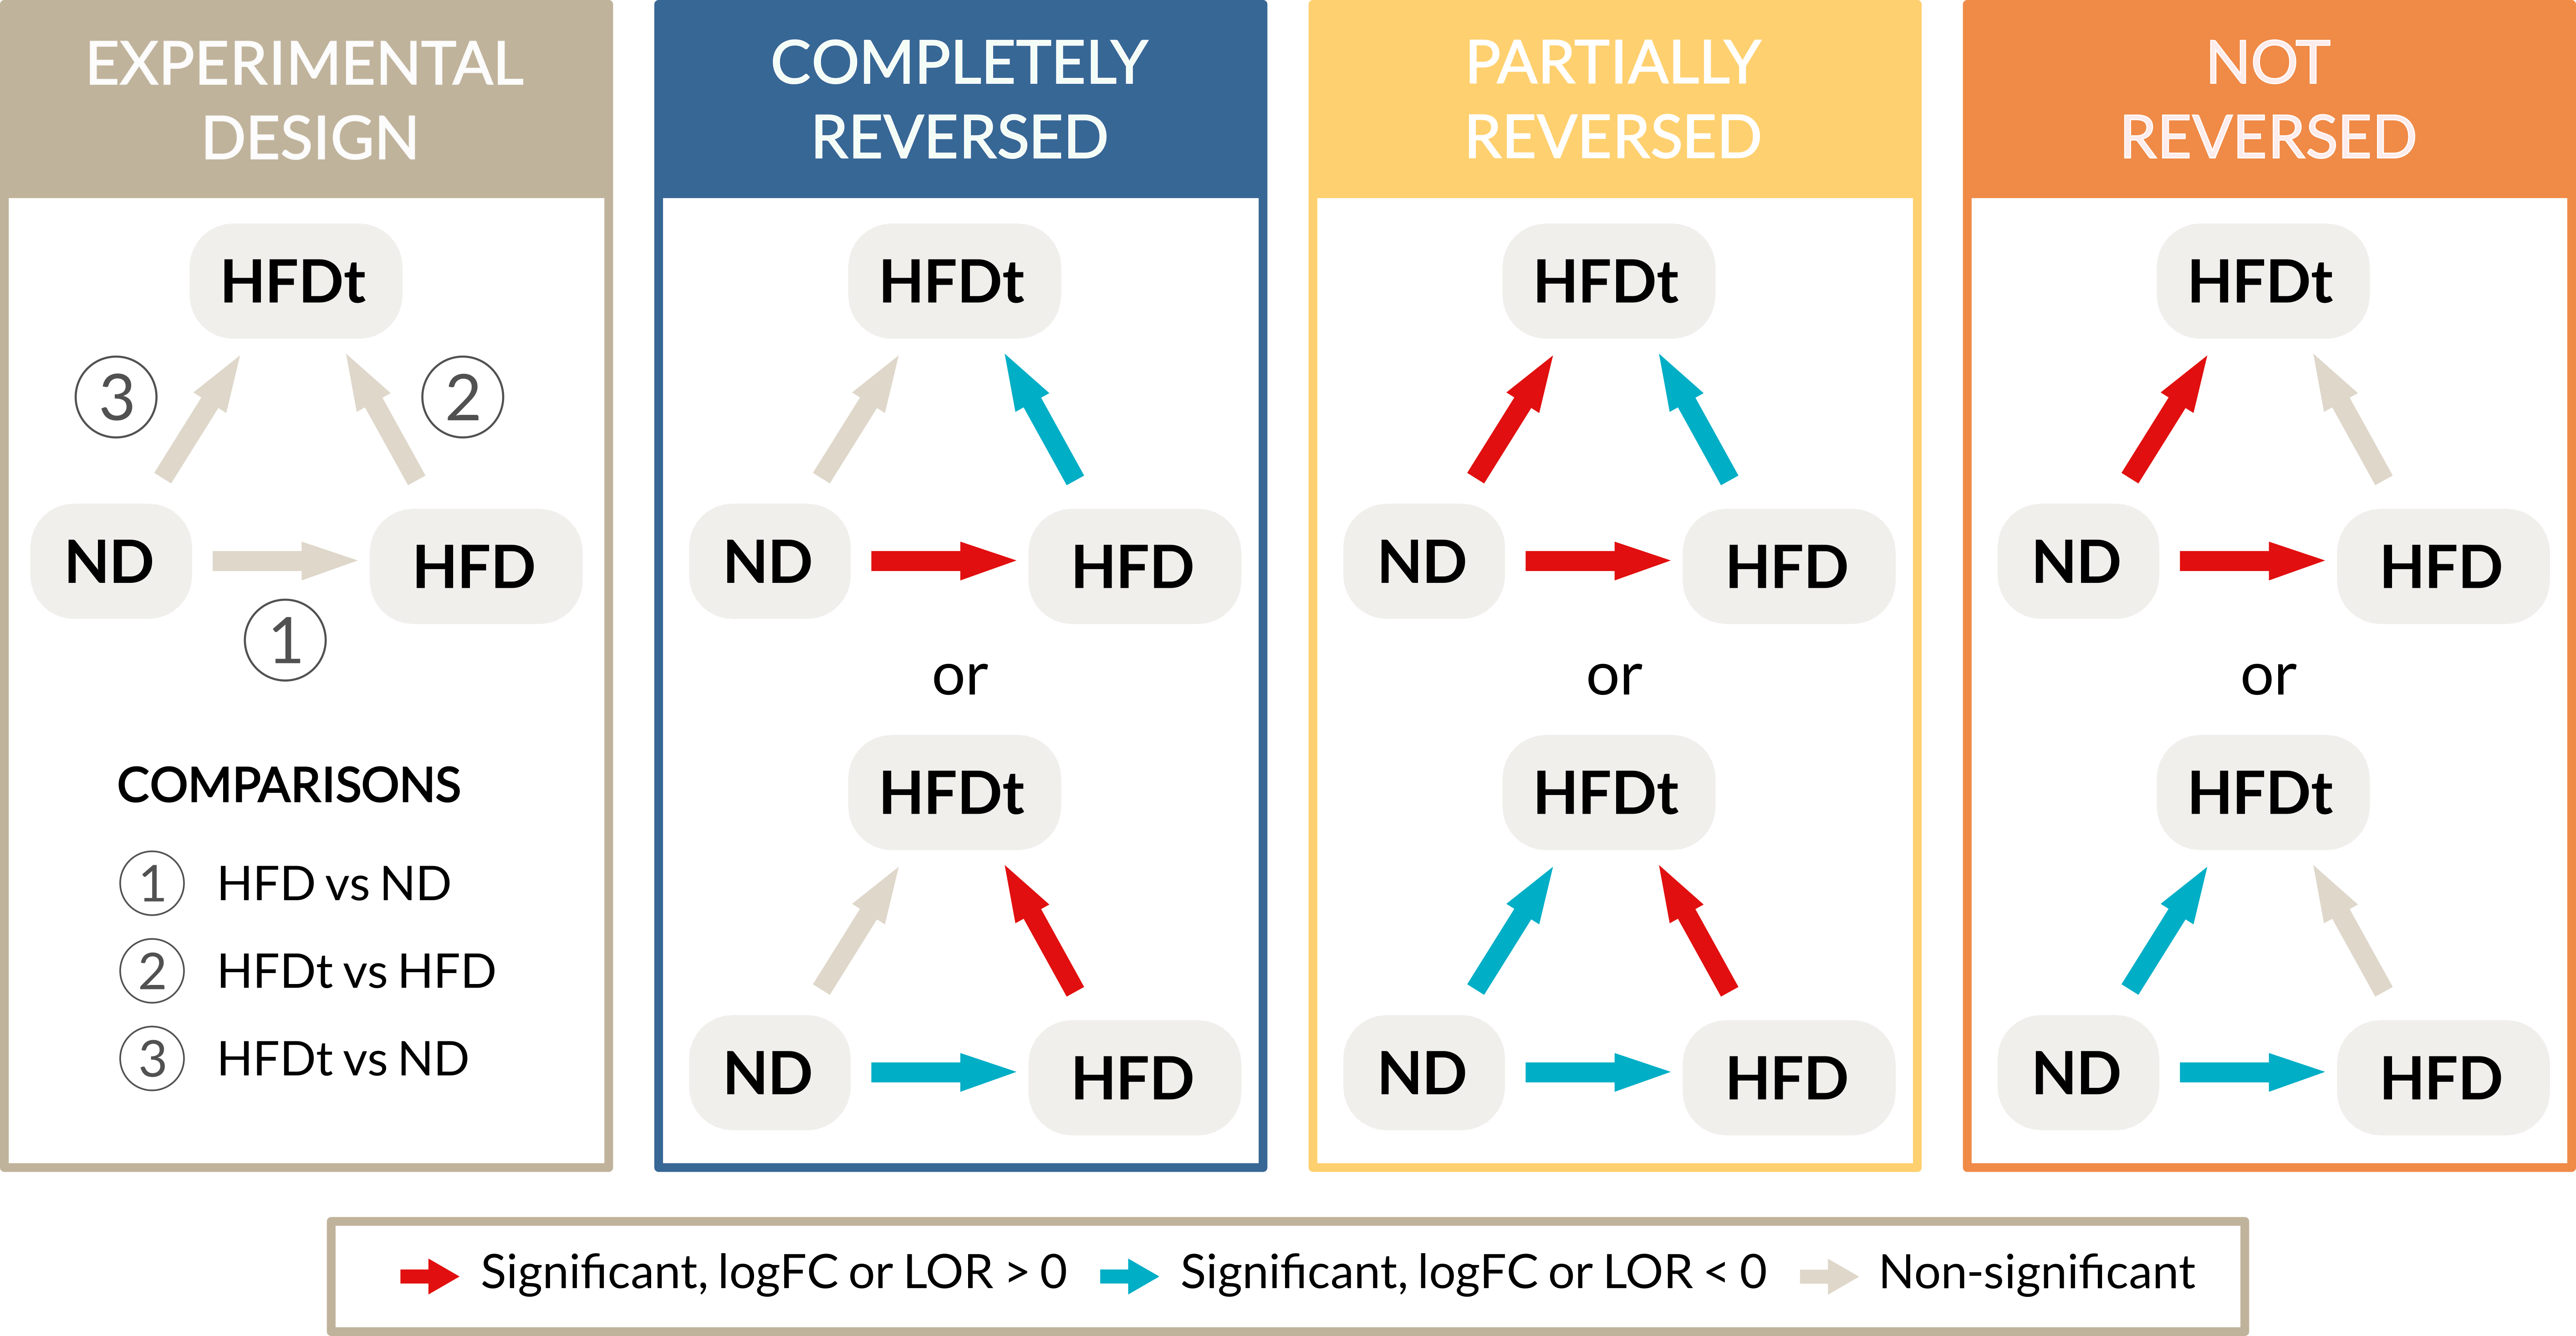
Graphical representation of the inclusion criteria for reversal definitions. The comparisons are numbered from 1 to 3, the groups are normal diet (ND), high fat diet (HFD) and high fat diet with treatment (HFDt). Colors represent the direction of change, being red up-regulation and blue down-regulation.


Completely reversed, partially reversed and not reversed genes observed in the different comparisons from the meta-analysis. UpSet plots comparing genes significantly modified in the meta-analysis and grouped according to the sign of logFC, respectively. Genes shown in blue columns are those considered reversed (altered in the HFD vs ND comparison and in the opposite direction in the HFDt vs HFD comparison). Genes considered not reversed are shown in orange columns (altered in the HFD vs ND comparison and still modified in the same direction in the HFDt vs ND comparison). Yellow columns indicate genes partially reversed (altered in the HFD vs ND comparison and modified in the opposite direction in the HFDt vs HFD comparison, which remained altered in the HFDt vs ND comparison in the same direction as in HFD vs ND). Finally, grey columns represent unclassified genes.


Completely reversed, partially reversed and not reversed biological processes observed in the different comparisons from the meta-analysis. UpSet plots comparing biological processes significantly modified in the meta-analysis and grouped according to the sign of LOR, respectively. Genes or biological processes shown in blue columns are those considered reversed (altered in the HFD vs ND comparison and in the opposite direction in the HFDt vs HFD comparison). Genes or biological processes considered not reversed are shown in orange columns (altered in the HFD vs ND comparison and still modified in the same direction in the HFDt vs ND comparison). Yellow columns indicate biological processes partially reversed (altered in the HFD vs ND comparison and modified in the opposite direction in the HFDt vs HFD comparison, which remained altered in the HFDt vs ND comparison in the same direction as in HFD vs ND). Finally, grey columns represent unclassified biological processes.


Bar charts representing biological processes altered in the HFD signature and grouped by GO categories.: The biological processes up-regulated (A) or down-regulated (B) in our HFD transcriptomic signature were grouped by GO categories using child-parent relationships defined by GO. The number of GO terms completely reversed, partially reversed or not reversed by the treatments within each category are represented in green, yellow and red tones, respectively. Dark tones represent upregulated GO terms in the HFD vs ND comparison, whereas down-regulated terms are shown in light tonesIn gray are the GO terms not classified by our definitions. Percentages of complete or partial reversion are shown for each category.


Bar charts representing biological processes altered in the HFD signature and grouped by GO categories.: The biological processes up-regulated (A) or down-regulated (B) in our HFD transcriptomic signature were grouped by GO categories using child-parent relationships defined by GO. The number of GO terms completely reversed, partially reversed or not reversed by the treatments within each category are represented in green, yellow and red tones, respectively. Dark tones represent upregulated GO terms in the HFD vs ND comparison, whereas down-regulated terms are shown in light tonesIn gray are the GO terms not classified by our definitions. Percentages of complete or partial reversion are shown for each category.


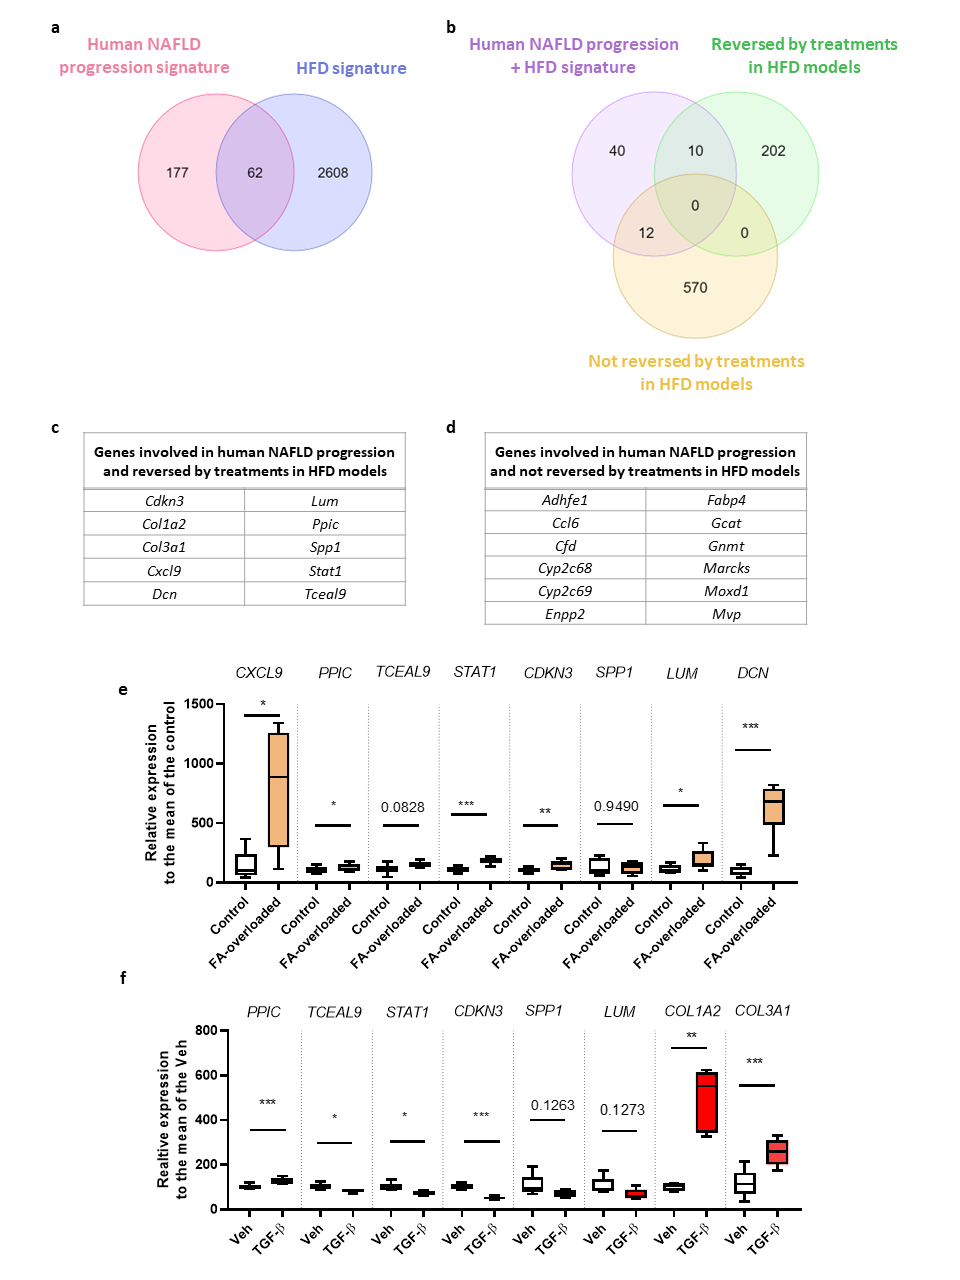
Comparison between HFD murine model and human NAFLD progression signature. a) Venn diagram comparing the HFD mouse model transcriptomic signature with a human NAFLD progression transcriptomic signature from the literature. b) Venn diagram comparing the 62 common genes between human NAFLD progression and HFD mouse model transcriptomic signatures with those whose expression was reversed or not by the anti-steatotic treatments in HFD mouse models according to our meta-analysis. c-d) Common genes between human NAFLD progression and HFD mouse model transcriptomic signatures whose expression was reversed (c) or not (d) by the treatments. e-f) Validation of gene expression in in vitro models of human hepatocytes overloaded with fatty acids (FA-overloaded) (e) and human profibrogenic hepatic stellate cells (treated with TGF-β) (f) for those candidate genes whose expression was reversed by treatments. Data were analysed by a paired t test (*p-value > 0.05, **p-value > 0.01, ***p-value > 0.001).

Phenotypic characteristics of HFD murine model

Available data on the metabolic and hepatic changes induced by the different high fat diet mouse models employed in the meta-analysis
Article (PMID) n Age (weeks) Diet contributors to liver damage HFD (weeks) Sex Phenotypic characteristics of HFD murine model
Body weight gain Insulin resistance Technique / Parameter Inflammation Technique / Parameter Liver fibrosis Technique / Parameter

Phenotypic characteristics of HFD murine model after treatments

Available data on the metabolic and hepatic changes induced by each of the anti-steatotic treatment studied in the meta-analysis.
Article (PMID) Treatment Dose Phenotypic characteristics of HFD murine model after treatments
Weight loss Improvement in IR Technique / Parameter Anti-steatotic effect Technique / Parameter Anti-inflammatory effect Technique / Parameter Anti-fibrotic effect Technique / Parameter