Analysis Summary
Abstract
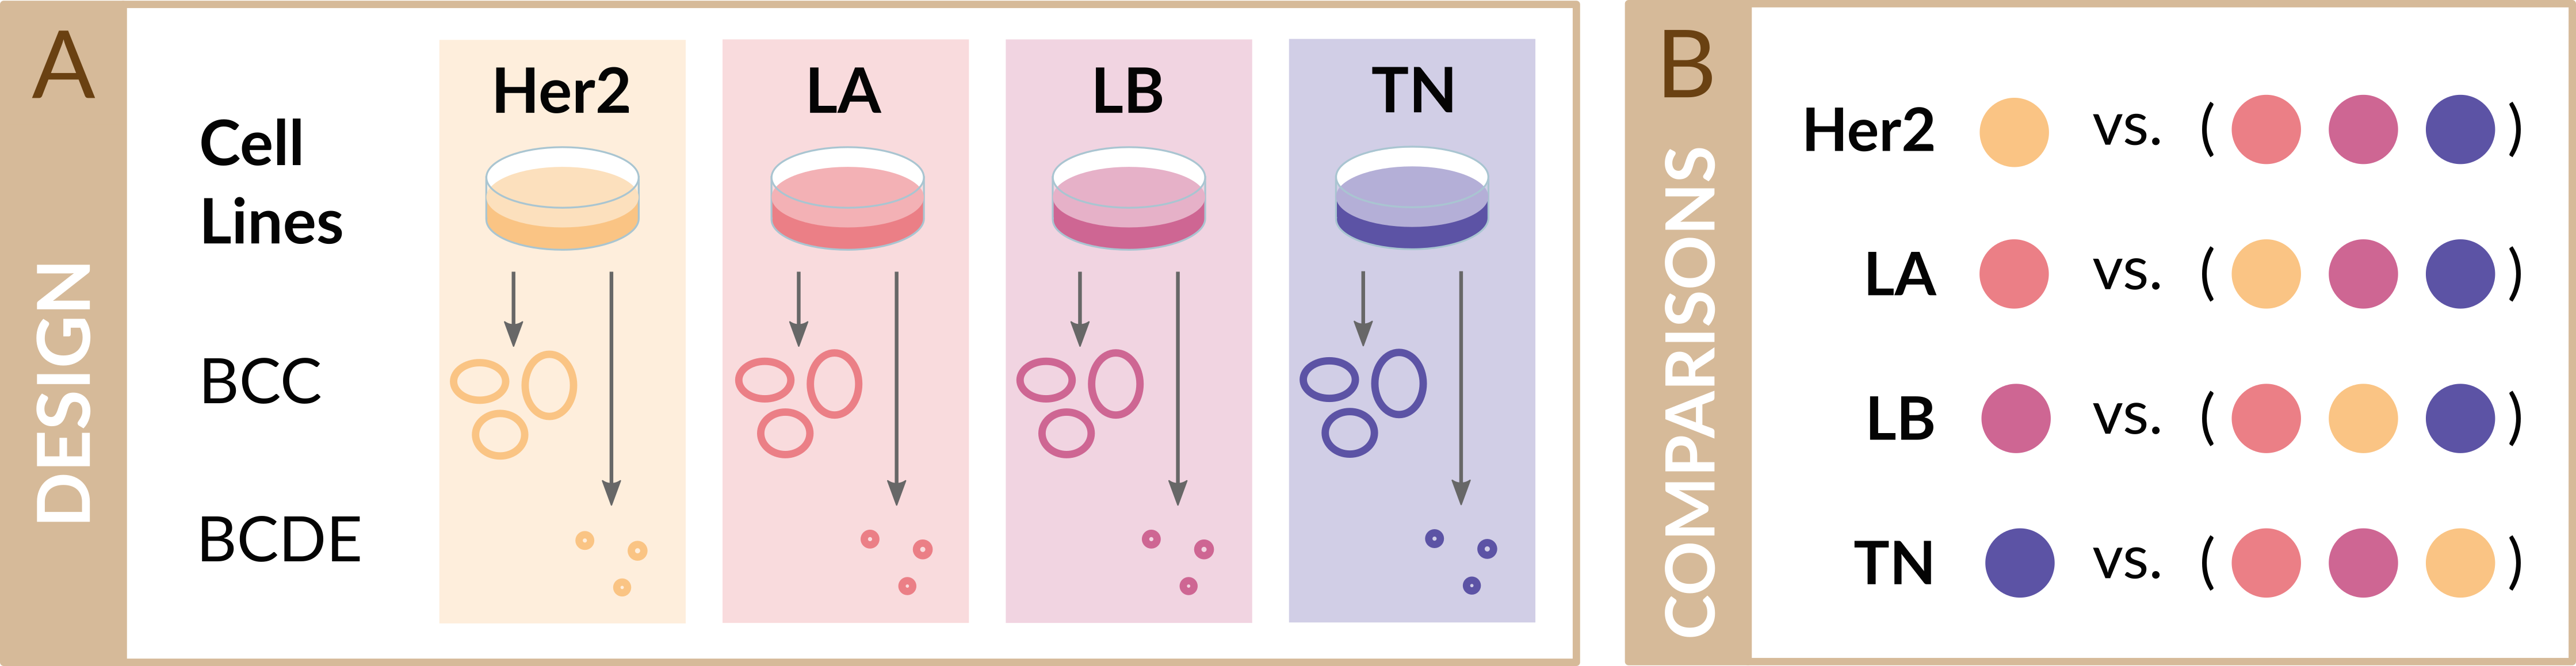
The discovery of novel breast cancer biomarkers will support patient stratification, enhance therapeutic outcomes, and improve non-invasive diagnostics. We compared the proteomic profiles of whole-cell and exosome samples of representative breast cancer cell subtypes to evaluate the potential of exosomes in liquid biopsies as non-invasive biomarkers. Overall, the observed differentially-expressed proteins in whole-cell and exosome samples (which included markers for invasion, metastasis, angiogenesis, and drug resistance) effectively discriminated subtypes; furthermore, our results confirm that the proteomic profile of exosomes reflects breast cancer cell-of-origin, thereby highlighting their potential as biomarkers in liquid biopsies. Our study will contribute to identifying biomarkers that will support breast cancer patient stratification and the development of novel therapeutic strategies. We include an open and interactive web tool to explore the data, providing a molecular resource that can help us understand the role of these protein signatures that stratify breast cancer subtypes.
Significant results
| Comparison | N Significant results | |||
|---|---|---|---|---|
| Down | Not | Up | ||
| BCC | Her2 | 43 | 1547 | 78 |
| LA | 62 | 1580 | 26 | |
| LB | 48 | 1580 | 26 | |
| TN | 109 | 1403 | 156 | |
| BCDE | Her2 | 51 | 271 | 67 |
| LA | 7 | 343 | 39 | |
| LB | 1 | 375 | 13 | |
| TN | 90 | 280 | 19 | |
Number of differentially expressed proteins in each of the comparisons performed in the analysis. A cutoff value of 0.05 was used.
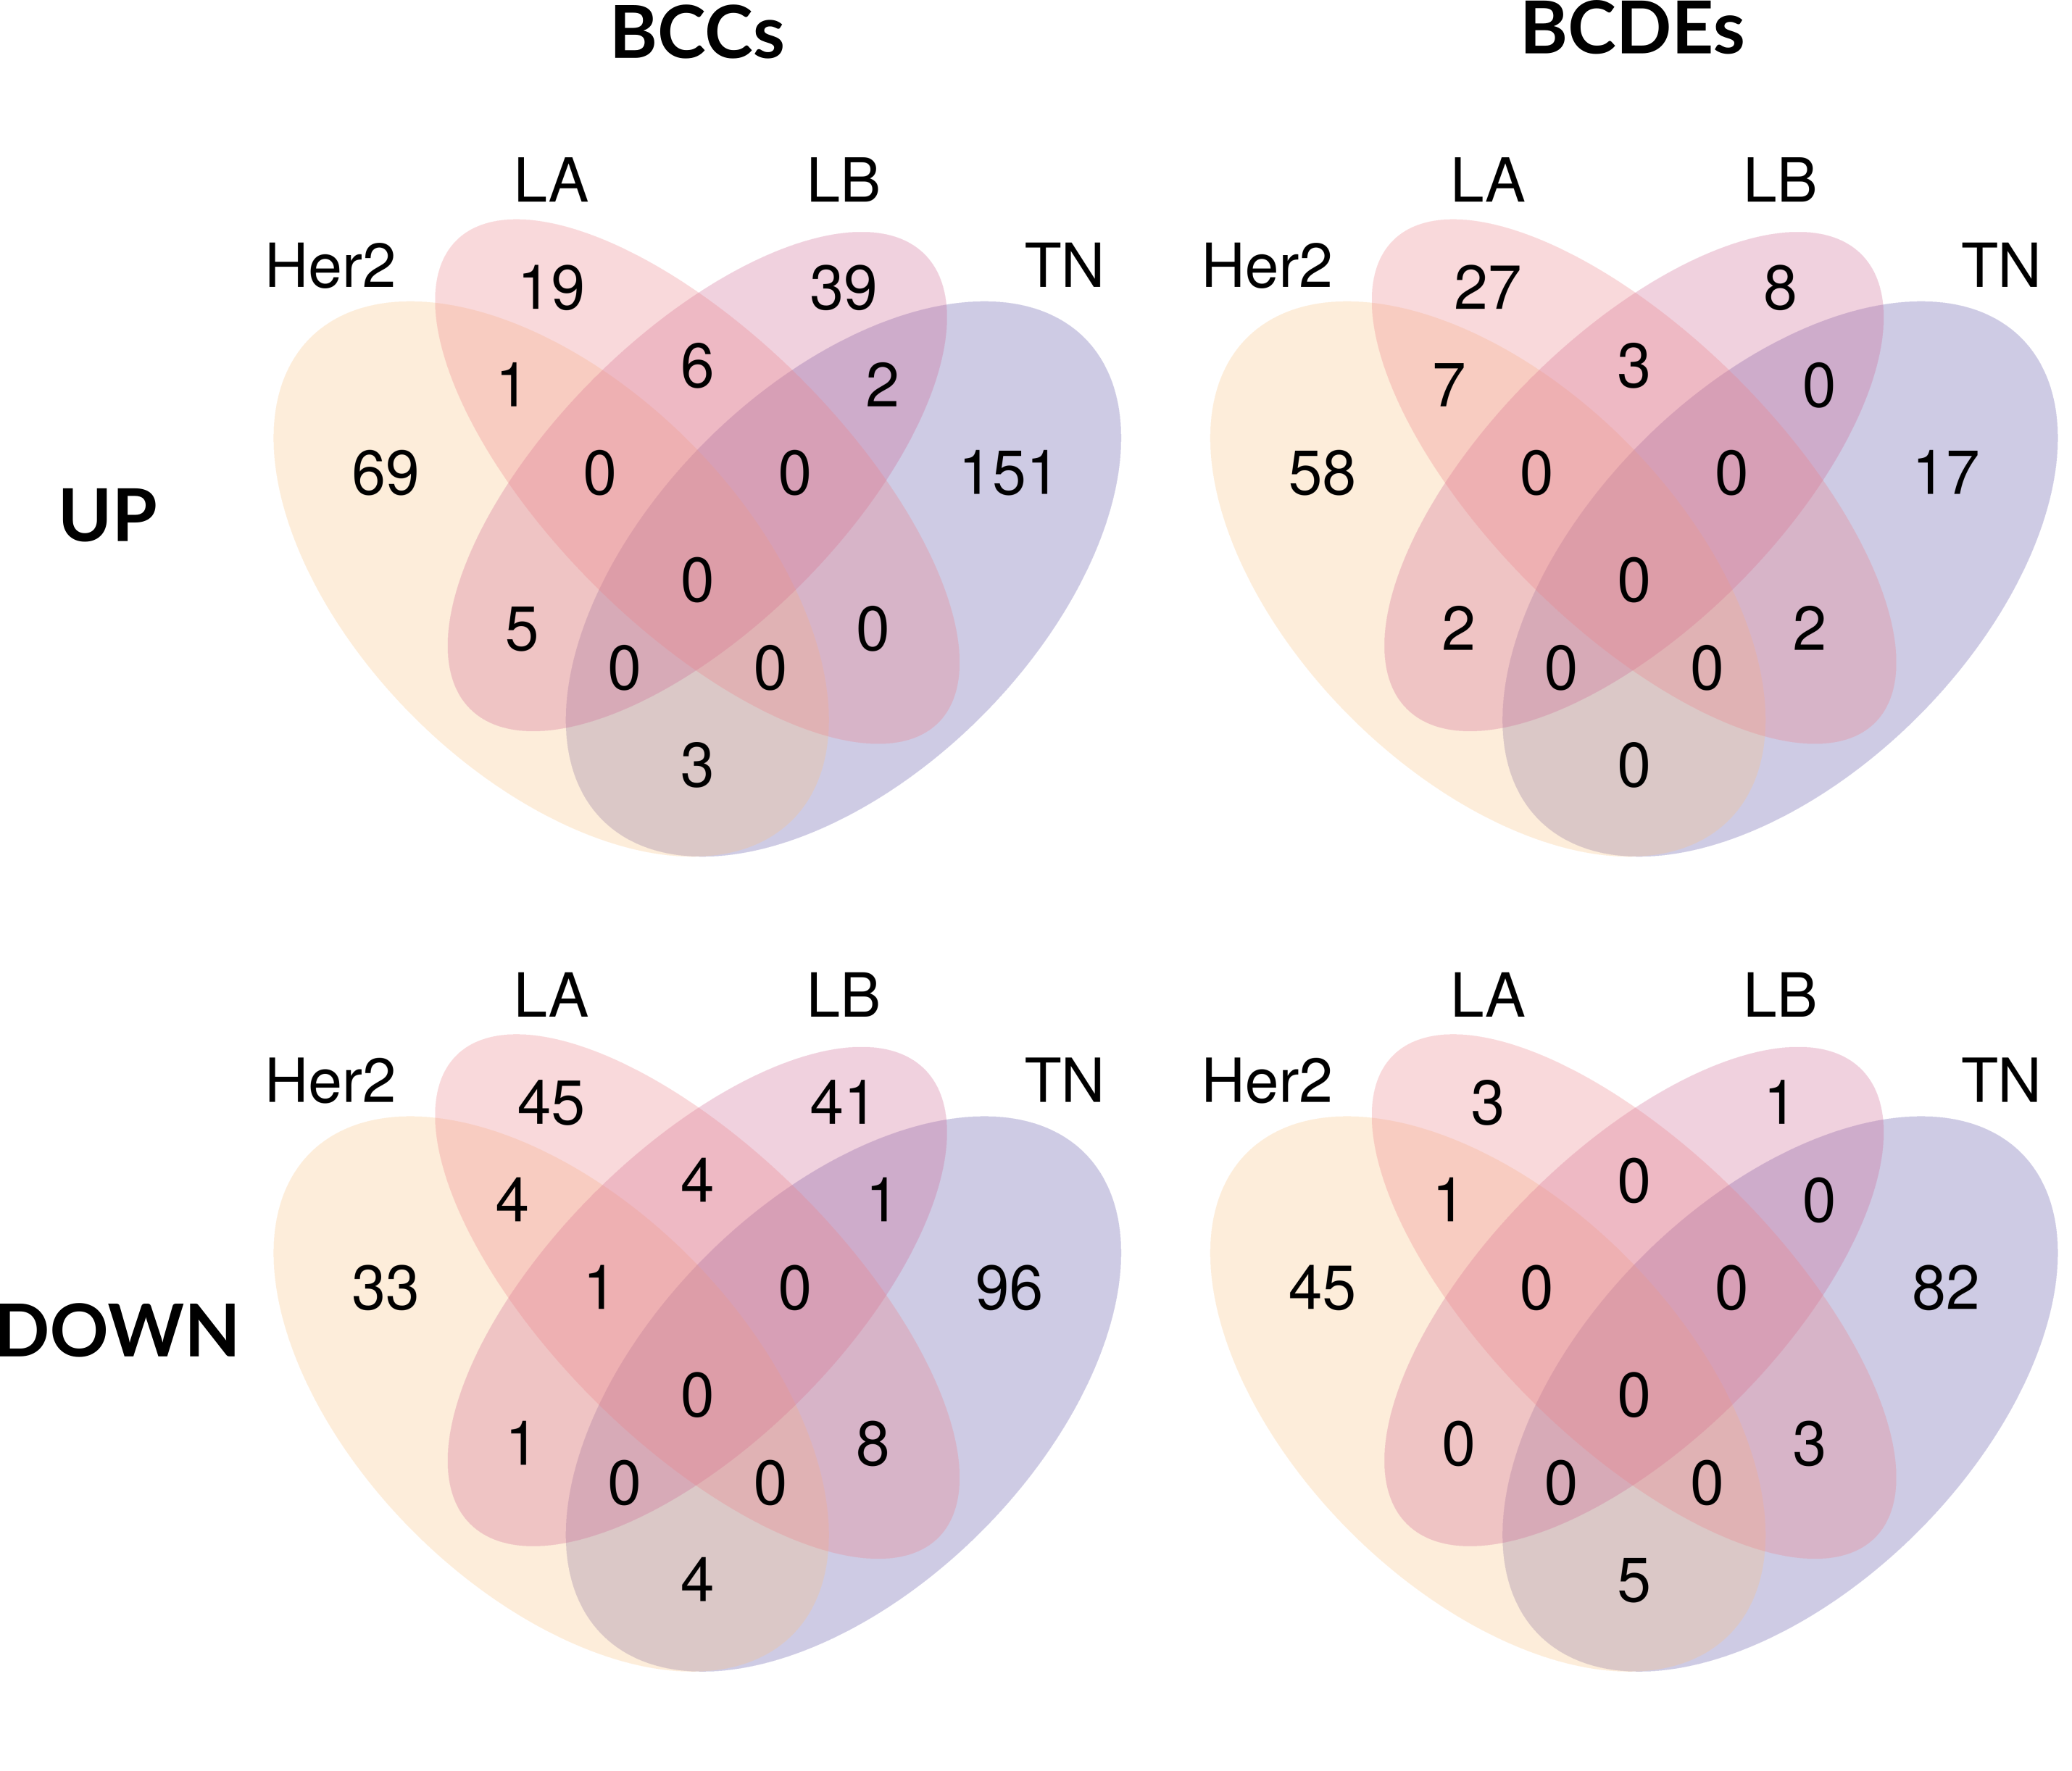
Number of differentially expressed proteins in each of the inersections.
Correlation analysis
This table shows the number of differentially expressed proteins in each of the comparisons performed in the analysis. A cutoff value of 0.05 was used.
| Comparison | Correlation | p value | Cell Line Proteins | Exosome Proteins | Common Proteins |
|---|---|---|---|---|---|
| TN vs (HER2 + LA + LB) | 0.6198 | 9.1834e-27 | 244 | 88 | 21 |
| HER2 vs (TN + LA + LB) | 0.4715 | 1.2292e-14 | 106 | 103 | 15 |
| LA vs (TN + HER2 + LB) | 0.45425 | 1.4333e-13 | 84 | 42 | 4 |
| LB vs (TN + HER2 + LA) | 0.5065 | 5.5411e-17 | 94 | 8 | 6 |
| TN vs HER2 | 0.5659 | 1.2262e-21 | 198 | 92 | 23 |
| TN vs LA | 0.5589 | 4.8442e-21 | 141 | 79 | 15 |
| TN vs LB | 0.6460 | 1.2452e-29 | 207 | 53 | 18 |
| HER2 vs LA | 0.4482 | 3.27128e-13 | 89 | 50 | 9 |
| HER2 vs LB | 0.4126 | 3.0485e-11 | 67 | 56 | 11 |
| LA vs LB | 0.4266 | 5.4426e-12 | 35 | 9 | 2 |