MetaRank Usage Instructions
MetaRank is a Shiny-based application designed for non-parametric meta-analysis of ranked gene lists. It allows users to combine multiple pre-ranked gene lists into a single consensus ranked list using robust statistical methods (RankProd and RobustRankAggreg). In addition, MetaRank allows functional interpretation by performing Overrepresentation Analysis (ORA) on the ranked genes of the consensus list.
This comprehensive tutorial provides step-by-step instructions on how to load ranked lists, customise ranking parameters, and visualise or interpret biologically enriched terms from the resulting consensus ranking.
- Overview
- Meta-analysis Options (
RankProdandRobustRankAggreg)- Rank Product (
RankProd) - Robust Rank Aggregation (
RRA) - Summary table
- Rank Product (
- RankProd Workflow
- Inputs
- Parameters
- Outputs
- RobustRankAggreg Workflow
- Inputs
- Parameters
- Outputs
- Shared Elements
- Shared Plots
- Shared Enrichment Analysis
- Data Visualization Tab
- Background Pipeline
- Best Practices
- Troubleshooting
1 Overview
MetaRank is a user-friendly Shiny application designed to unify ranked gene lists from multiple studies and extract a consensus ranking of the most consistently relevant genes. It provides two distinct analytical workflows, Rank Product (RP) and Robust Rank Aggregation (RRA), allowing users to choose the method that best fits their data structure and research goals. The app includes a rich set of features for data input, configuration, enrichment, and visualization. Its key features include:
Choice of meta-analysis algorithm:
Rank Product (RP):A weighted approach that incorporates both gene rankings and associated scores as pvalues or fold changes.Robust Rank Aggregation (RRA):A non-weighted method based on rank positions only, suitable for plain ordered gene lists.
Flexible input options and parameter settings tailored to each method:
- RP mode:
- Supports both file upload and text paste (using
"###"to separate lists). - Accepts
.txt,.csv, and.tsvfiles containing genes with numerical values. - Includes example datasets for quick testing and file downloads.
- Offers a choice between basic and advanced Rank Product functions.
- Customizable settings for handling
NAvalues and filtering genes by minimum list appearance.
- Supports both file upload and text paste (using
- RRA mode:
- Accepts plain-text files or pasted input with one gene per line (using
"###"to separate lists). - Only
.txtformat is supported to avoid structure conflicts. - Provides example data and downloadable templates.
- Includes several aggregation options such as “RRA”, geometric mean, median or minimum rank.
- Also allows configuration of
NAhandling and list inclusion thresholds.
- Accepts plain-text files or pasted input with one gene per line (using
- RP mode:
Post-ranking functional enrichment:
- Enables Over-Representation Analysis (ORA) on the top-ranked genes.
- Compatible with the Gene Ontology (GO), KEGG, and Reactome databases, as well as the possibility of using custom annotations. .
- Supports multiple organisms: Homo sapiens, Mus musculus, and Rattus norvegicus.
- Accepts gene identifiers in
SYMBOL,ENTREZID, andENSEMBLformats.
Interactive visualization and result export:
- Explore input overlap with Heatmaps and UpSet plots.
- View enriched terms using interactive Bar plots and Dot plots.
- All result tables are interactive and downloadable in
.csvor.tsvformats. - Customise each graph and table in the
Data Visualisationtab.
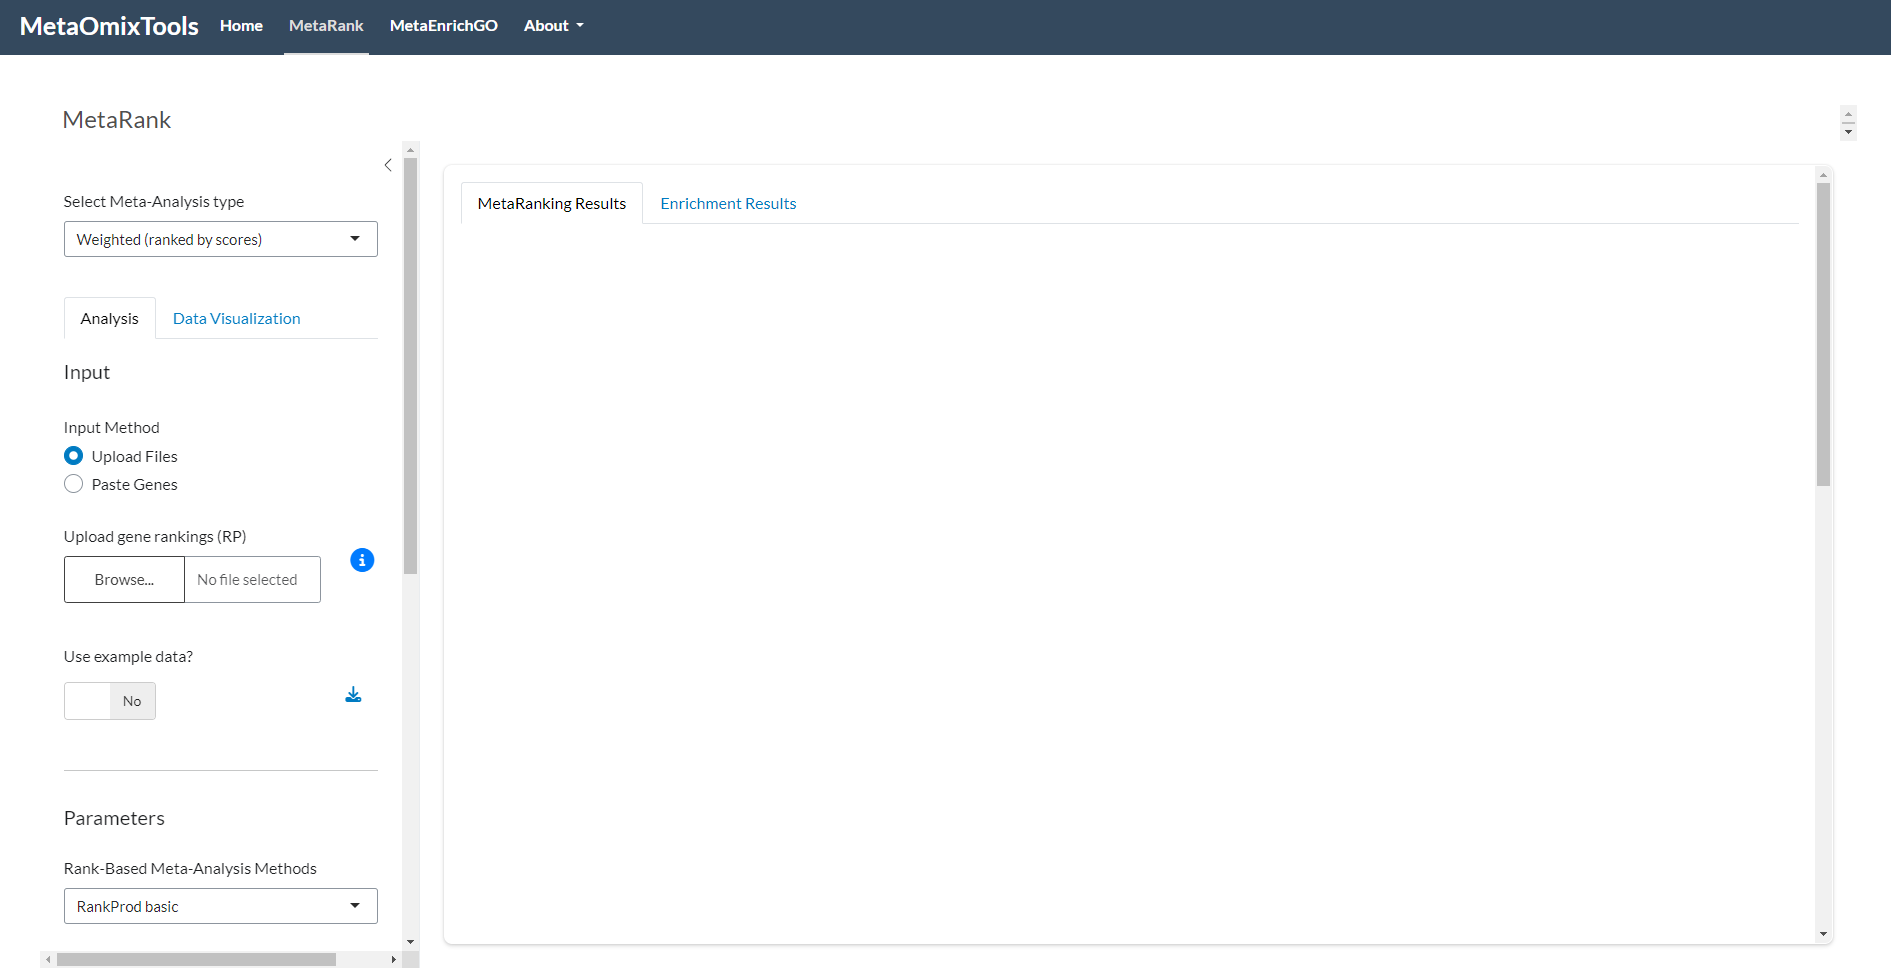
Figure 1: MetaRank Overview. Initial interface displayed upon accessing the tool.
2 Meta-analysis Options
MetaRank provides two robust statistical methods for integrating ranked gene lists from multiple studies: Rank Product (RankProd) and Robust Rank Aggregation (RRA). These methods are designed to identify genes that consistently appear at the top of ranked lists, thereby highlighting potential candidates for further biological investigation.
2.1 Rank Product (RankProd)
The Rank Product method is a non-parametric statistical approach for identifying differentially expressed genes based on the consistency of gene rankings across multiple datasets. It is particularly suitable for meta-analyses that combine results from different studies, as it does not rely on data normality and is relatively robust to outliers.
Key features:
- Non-parametric analysis: Does not assume any particular data distribution, allowing application to heterogeneous datasets.
- Geometric mean aggregation: Ranks are combined using the geometric mean, giving greater weight to genes consistently ranked at the top.
- False discovery rate estimation: Provides an estimate of the proportion of false positives (pfp) to evaluate the statistical significance of the results.
- Cross-platform applicability: Designed to integrate data from diverse experimental conditions or technologies.
Recommended use cases:
- Works best with complete and balanced gene lists, where most genes are consistently represented across all datasets.
- Suitable when datasets have similar quality and measurement platforms, minimizing unwanted variability.
- Performs optimally with a moderate number of lists (approximately 5 to 20), ensuring a balance between sensitivity and computational cost.
- Less effective in the presence of high proportions of missing values or when gene representation is inconsistent, although these limitations can be mitigated using filtering based on minimum gene appearance and applying penalization strategies.
- Execution time is relatively high, especially when using permutation-based significance testing on large datasets.
- May be moderately influenced by outliers, particularly in smaller datasets with high variability.
The Rank Product method is implemented in the Bioconductor package RankProd, which provides functions for performing the analysis and visualizing the results.
2.2 Robust Rank Aggregation (RobustRrankAggreg)
Robust Rank Aggregation (RRA) is a probabilistic method designed to identify genes that are consistently ranked higher than expected by chance across multiple input lists. It is particularly effective in scenarios involving noisy data, incomplete lists, or substantial variability among datasets.
Key features:
- Probabilistic modeling: Computes p-values by modeling the probability of observing gene rankings under a null model.
- Robustness to noise and variability: Maintains performance in the presence of random noise, outliers, or inconsistencies between lists.
- Adaptable to varying list lengths: Can accommodate lists of different sizes without requiring imputation or alignment.
- No parameter tuning required: Offers a straightforward implementation without the need for user-defined parameters.
Recommended use cases:
- Appropriate for heterogeneous datasets obtained from different experimental conditions, platforms, or studies.
- Particularly suitable when gene lists are incomplete or vary significantly in content and length.
- Scales efficiently with a large number of input lists (more than 20), taking advantage of increased data diversity to improve robustness.
- Demonstrates high resistance to noise, performing reliably even if some input lists contain irrelevant or partially random data.
- Does not consider the magnitude of expression differences, focusing solely on rank order.
- Assumes independence among ranked lists, which may not always be valid in certain experimental designs.
- The interpretation of significance scores may be less intuitive due to the probabilistic nature of the method.
The RRA method is implemented in the CRAN package RobustRankAggreg, which offers functions for list aggregation and significance estimation.
2.3 Summary table
| Feature | Rank Product | Robust Rank Aggregation |
|---|---|---|
| Data completeness | Requires complete gene presence across lists | Supports partial and incomplete lists |
| List consistency | Performs best with uniform list lengths | Handles varying list lengths and contents |
| Handling of missing data | Limited unless filtered or penalized | Naturally tolerant to missing genes |
| Number of input lists | Optimal with 5–20 lists | Scales well with more than 20 lists |
| Noise resistance | Moderate | High |
| Execution time | Higher due to permutation testing | Lower, computationally efficient |
| Quantitative interpretation | Considers expression magnitude indirectly | Considers only rank order |
| Recommended applications | Datasets with consistent platforms and full coverage | Integration of diverse and incomplete datasets |
Table 1: Comparison of Meta-Analysis Methods. Overview of the key characteristics, operational differences, and input requirements between RankProd (RP) and Robust Rank Aggregation (RRA).
3 RankProd Workflow
3.1 Input Methods
MetaRank allows users to input ranked gene lists for Rank Product analysis in three flexible ways:
Upload Files:
When the “Upload Files” mode is selected, users can upload one or more files in.txt,.tsv, or.csvformat. Each file represents a ranked gene list from a separate study. The system expects each file to contain at least two columns: a gene identifier (e.g.,TP53) and a numeric score representing the expression level, or any other ranking criterion. It is recommended to follow this instructions:- Supported encodings:
UTF-8. - Supported delimiters: comma (
,) or tab (\t) (automatically detected). - Do not include headers: remove the corresponding headers for either column names or row names.
- Scores are mandatory: if no score are detected, an error will be displayed
- Complex gene entries (e.g.,
HBA2///HBA1) are parsed, and only the first gene is retained. (HBA2) - NA values, blank lines, and duplicate genes are cleaned automatically.
Clicking the ℹ️ icon opens a modal window showing the expected file structure and format. It is important to note that the application enforces a maximum file size limit of 30 MB per file. Beyond this specific constraint, there is no strict limit to the number of gene lists that can be uploaded, as this depends on the memory usage of each list. For example, when lists contain approximately 20,000 genes, up to 12 have been successfully processed. In contrast, for smaller lists (ranging from 100 to 500 genes), the system has handled up to 50 lists without issue.
- Supported encodings:
Note
Many interface elements include contextual tooltips activated by hovering. These tooltips explain each input option, accepted formats, and internal validation steps. For example, hovering over the Use Example Data toggle reveals the origin of these datasets, while hovering over the text input area shows how to format pasted genes properly.
Paste Genes:
When the “Paste Genes” mode is enabled, users can manually paste ranked gene lists into a large text area. This mode supports both.csvand.tsvformatting, selectable from a dropdown. Each list must be separated by the string###, and within each block, one gene per line is expected. The score must follow the gene, separated by a tab or comma:Example format (tsv) Technical format (tsv) TP53 0.95 TP53\t0.95\n BRCA1 0.91 BRCA1\t0.91\n EGFR 0.85 EGFR\t0.85\n ### ### BRCA1 0.95 BRCA1\t0.95\n EGFR 0.91 EGFR\t0.91\n TP53 0.85 TP53\t0.85 Example format (csv) Technical format (csv) MYC,0.93 MYC,0.93\n CDK2,0.88 CDK2,0.88\n FOXO1,0.80 FOXO1,0.80n ### ### CDK2,0.93 CDK2,0.93\n FOXO1,0.88 FOXO1,0.88\n MYC,0.80 MYC,0.80Similar to file upload, pasted inputs are automatically cleaned of duplicates and malformed entries. The placeholder text in the input box provides a working example for guidance.
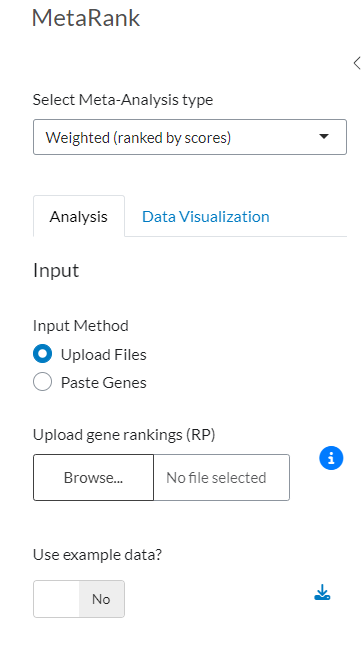
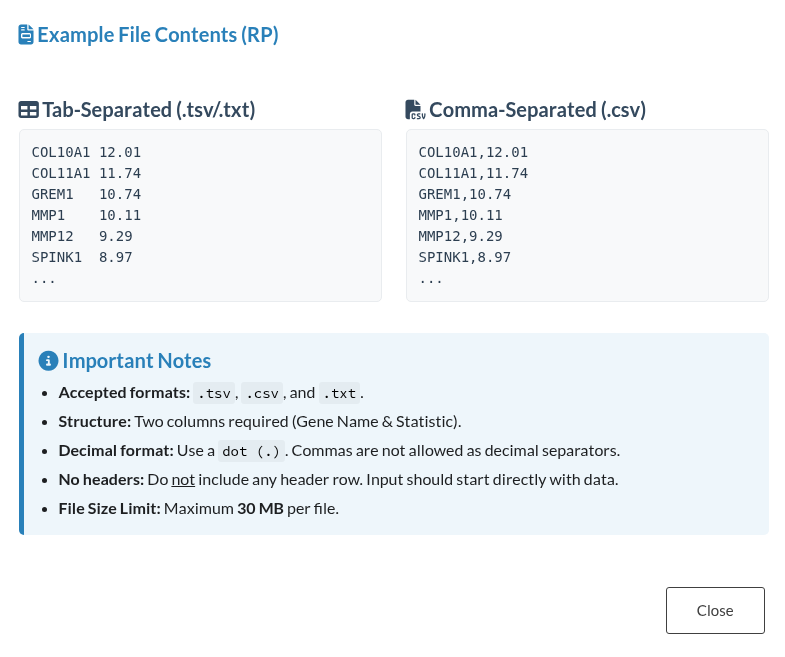
Figure 2: Data Input Interface for Rank Product (RP). (a) Configuration panel for selecting input methods, including file upload and text pasting. (b) Informational modal displaying the required file structure, column specifications, and formatting constraints.
Use Example Data:
Enabling the “Use Example Data” switch loads four datasets for demonstration purposes. These examples simulate real analysis scenarios with pre-ranked gene lists across multiple studies, allowing users to explore the workflow without providing their own data.The table above shows four gene lists used in our example analysis. These lists come from four independent studies related to lung cancer and associated with the following identifiers: GSE10072, GSE19188, GSE63459, GSE75037. Each two columns corresponds to a list, containing 22283, 54675, 24526 and 48803 gene identifiers (SYMBOL) respectively, including duplicate or missing entries. Each gene has its associated statistical value in the second column (in this case, pvalue). This arrangement allows direct comparison of the size and composition of the lists across studies, highlighting the diverse scope of each dataset prior to subsequent meta-analysis. If the user wishes to study this data in depth, it is possible to download these datasets, as well as view their distribution in the UpsetPlot (Section 5.1.1.) and Heatmap (Section 5.1.2.).
Table 2: Example Data Overview. Gene identifiers and associated statistical scores from the four lung cancer studies used to demonstrate the workflow.
3.2 Parameters
Once the gene lists are loaded, six configuration parameters become available to customize the RankProd analysis. These options provide full control over how genes are filtered and ranked. You can fine-tune aspects such as ranking direction, handling of missing values, penalization of genes with low recurrence, and the minimum number of lists a gene must appear in to be considered. This flexibility ensures the meta-analysis is aligned with your experimental design and data quality.
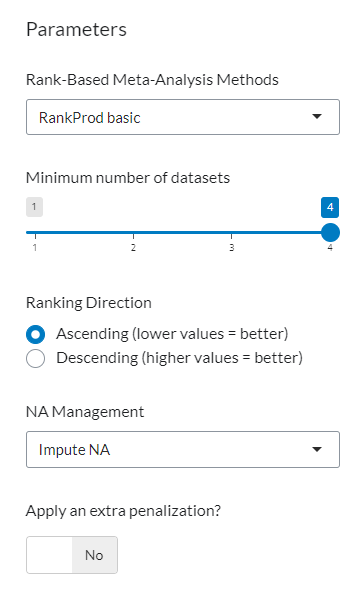
Figure 3: RankProd Analysis Parameters. Configuration panel displaying the six settings available to customize gene filtering and ranking criteria.
3.2.1 Rank-based Method
A rank-based meta-analysis combines gene rankings across multiple studies or conditions instead of directly comparing raw values. This approach is especially useful when datasets are heterogeneous or measured on different scales, allowing robust integration based on gene order rather than absolute expression.
There are two available modes:
Basic: Uses
RankProd::RP. It assumes that each gene list comes from a unique origin (i.e., no shared batches). This is ideal when the true origin of your data is unknown or when you prefer not to group them explicitly. Suitable for datasets with unknown or homogeneous background (e.g., mixed public data without batch labels).Advanced: Uses
RankProd::RP.Advanced. This mode allows specifying a vector of origins (or batches) for each list via the Origin field (Section 3.2.2.). Recommended when your gene lists come from distinct experimental setups, platforms, conditions, or time points. It adjusts the ranking by grouping lists with the same origin, improving robustness in multi-batch scenarios.
3.2.2 Origin (Advanced only)
The Origin field is required when using the Advanced mode. It should be a comma-separated vector of integers (e.g., 1,1,2,2), where each number indicates the batch or origin of the corresponding input file.
This field:
- Must match the number of input gene lists.
- Allows grouping lists from the same source.
- Each batch must have replicas, i.e. at least two datasets from the same source.
- Is validated with custom error messages if the format is incorrect or inconsistent.
- Is accompanied by an ℹ️ info button with a usage example for user guidance.
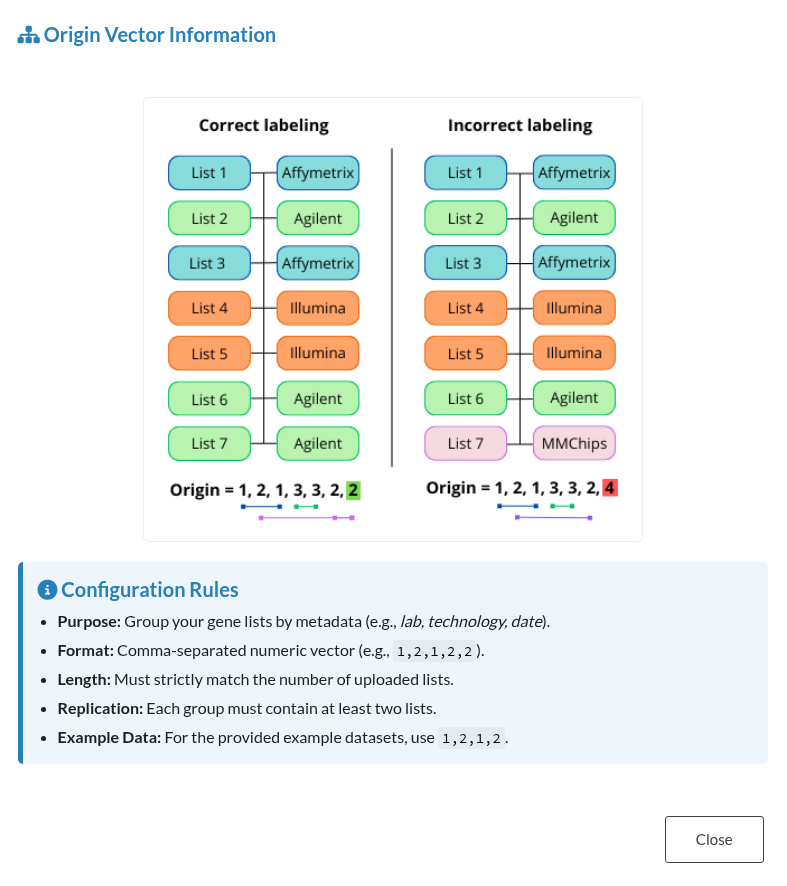
Figure 4: Origin Input Guidance. Information window displaying the required format, validation rules, and examples for the Origin vector.
3.2.3 Minimum Number of Datasets
This slider sets the minimum fraction of input lists in which a gene must appear to be included in the analysis. Genes present in fewer lists will be excluded before the ranking process. For example: If you set it to 4 and there are 5 input lists, only genes appearing in at least 4 lists will be considered (4 and 5).
This filter helps reduce statistical noise caused by infrequent genes that may distort the consensus ranking. Genes that appear only once are always shown separately in the “Excluded genes” table, since they do not allow robust comparison and may bias the analysis if included.
3.2.4 Ranking Direction
This option indicates whether lower or higher values should be considered better rankings. This depends on the type of metric:
Ascending: lower values are better (e.g., pvalues).Descending: higher values are better (e.g., logFC, z-scores, relevance scores).
It is important to choose the correct direction to ensure proper interpretation of the results.
3.2.5 NA Management
This option determines how to handle missing values (genes not present in some of the lists):
| Option | Description |
|---|---|
| Impute NA | Replaces NA with the median rank of the list. Allows applying an extra penalty based on the number of appearances. Useful when preserving all genes and reducing the impact of missing values, for example in exploratory analyses. |
| Ignore NA | Uses only the available values, omitting NAs. Also allows extra penalization based on the number of appearances. Useful when preserving all genes and reducing the impact of missing values, for example in exploratory analyses. |
| Penalize NA | Assigns the worst possible rank to missing values, depending on whether the direction is ascending or descending. Recommended when missing values should be heavily penalized to increase robustness. |
Table 3: NA Management Options. Description of the three available strategies for handling missing values during the ranking process.
Note
If you apply a Minimum Number of Datasets filter that requires genes to appear in all lists, there will be no missing values and this setting will have no effect. Note that the impact of missing value management depends on how strict or tolerant the user wants the analysis to be. More relaxed settings retain more genes but may introduce noise, while stricter settings increase reliability but may discard potentially relevant genes.
3.2.6 Extra Penalization (Impute & Ignore only)
When this option is enabled, an additional penalty is applied to each gene depending on the number of lists in which it appears (calculated before the analysis, but applied after it). The fewer times a gene appears, the worse its adjusted ranking will be, even if it initially ranked well. An adjusted rank is calculated by adding a penalty proportional to the number of lists where the gene is missing.
Conceptual formula:
AdjustedRank = Rank + ((TotalLists - Count) * (MaxRank / TotalLists))Where:
Rank: the original consensus rank of the gene.TotalLists: the total number of gene lists loaded.Count: the number of lists in which the gene appears.MaxRank: the worst (highest) rank in the current ranking.
This adjustment is especially useful when using the Impute or Ignore NA options, to ensure that genes with limited support across datasets are penalized accordingly and do not dominate the top of the consensus ranking. This helps to prioritize genes that are consistently present and reduce the impact of rare, potentially spurious genes.
3.3 Outputs
3.3.1 Results Table (RankProd)
The main output of the RankProd analysis is a table with the following columns and their meanings:
| Column Name | Description |
|---|---|
| GeneID | Unique gene identifier, which can be a HUGO symbol (e.g., TP53), an Entrez ID (e.g., 7157), or an Ensembl ID (e.g., ENSG00000141510), depending on input. |
| Rank | Consensus ranking of the gene across all input lists; lower values indicate higher overall relevance or consistency among the lists. |
| FileCount | Number of input gene lists in which this gene appears; a higher count suggests greater consistency across datasets. |
| FileNames | Names of the input files where the gene was found, separated by spaces; useful for identifying the sources supporting the gene’s relevance. |
| GenePositions | Ranking positions already sorted by gene in each individual input list; provides information on gene performance across different datasets. |
| RP_stat | Rank Product statistic calculated to assess the significance of the gene’s ranking across multiple lists; lower values suggest higher significance. |
| PFP | Estimated Proportion of False Positives, analogous to False Discovery Rate (FDR); lower values indicate more reliable findings. |
| pvalue | Raw p-value from the meta-analysis, indicating the probability of observing the gene’s ranking by chance; lower values suggest higher significance. |
| p.adjust | Adjusted p-value accounting for multiple hypothesis testing using the Benjamini-Hochberg method; helps control the FDR. |
Table 4: RankProd Results Structure. Description of the gene identifiers, ranking metrics, and statistical values provided in the analysis output.
The table can be downloaded in .tsv and .csv formats. Each column has a tooltip (question mark icon) that shows this information when hovered over. The table is interactive: columns can be filtered by value ranges or keywords, and their order can be customized.
Tip
If data filtering is applied, either by value or by selecting specific columns (Section 5.3.1), the downloaded file will reflect only the currently displayed data. This includes both the filtered rows and the visible columns selected in the user interface.
3.3.2 Excluded Genes
A secondary table is generated and accessible via the eye icon button, also downloadable as .tsv. It always contains genes excluded by the Minimum Number of Datasets filter and those appearing only once. If, for example, a filter of 4/4 is applied, genes appearing in 1, 2, or 3 lists are moved to this excluded table, while only genes appearing in all 4 lists remain in the main table. This table allows tracking of excluded genes and understanding of filtering effects.
| Column Name | Description |
|---|---|
| GeneID | Unique identifier of the excluded gene, in the same format as the input. |
| FileCount | Number of input gene lists in which this gene appears. |
| FileNames | Names of the input files where the gene was found. |
Table 5: Excluded Genes Table. Description of the columns for genes that did not meet the minimum occurrence threshold defined in the filters.
4 RobustRankAggreg Workflow
4.1 Input Methods
Upload Files: When the “Upload Files” mode is enabled, it is possible to select one or more text files (
.txt) via the file upload control. The system recognizes each file as a list of genes (one identifier per line, without a header), automatically removes duplicates and missing values, and correctly handles both Unix (\n) and Windows (\r\n) line endings. If more than one gene is provided on a single line separated by delimiters (e.g.,BRCA1///BRCA2), only the first entry (BRCA1) is retained.Clicking the ℹ️ icon opens a modal showing a sample file structure, and example datasets can be downloaded for in-depth study and reference. There is no strict limit to the number of gene lists that can be uploaded, as it depends on the size of each list. For example, when lists contain approximately 20,000 genes, up to 12 have been successfully processed. In contrast, for smaller lists (ranging from 100 to 500 genes), the system has handled up to 50 lists without issue.
Paste Genes: When the “Paste Genes” mode is enabled, gene lists can be entered directly into a text area. Each list is delimited by
###, and within each section the system expects one gene per line, with no header row.Example format Technical format TP53 TP53\n BRCA1 BRCA1\n EGFR EGFR\n ### ###\n BRCA1 BRCA1\n EGFR EGFR\n TP53 TP53Duplicate entries and blank lines are cleaned up automatically, and if a line contains multiple gene identifiers (e.g.,
BRCA1///BRCA2), only the first is used. The placeholder text illustrates this formatting.
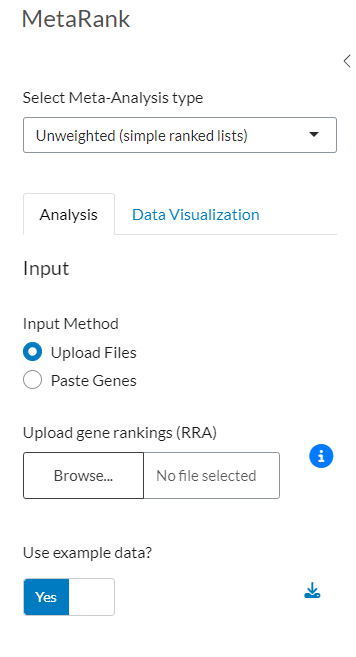
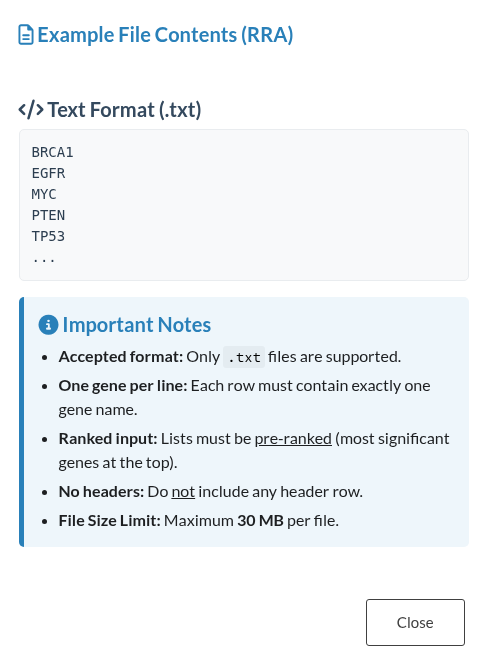
Figure 5: Input Options for Robust Rank Aggregation. (a) Interface for uploading files or pasting gene lists, and (b) Information window detailing the required file structure and formatting.
Use Example Data: Enabling the “Use Example Data” switch loads predefined files that represent various analysis scenarios, allowing users to explore the workflow without providing their own data.
The table above shows four gene lists used in our example analysis. These lists come from four independent studies related to lung cancer and associated with the following identifiers: GSE10072, GSE19188, GSE63459, GSE75037. Each column corresponds to a list, containing 19417, 21752, 17509 and 13099 gene identifiers (SYMBOL) respectively, including duplicate or missing entries. This arrangement allows direct comparison of the size and composition of the lists across studies, highlighting the diverse scope of each dataset prior to subsequent meta-analysis.
Table 6: Example Gene Lists. Overview of the gene identifiers from four lung cancer studies included for demonstration purposes.
4.2 Parameters
Once the gene lists are loaded, three configuration parameters become available to customize the RobustRankAggreg analysis. These options provide some control over how genes are filtered and ranked. You can fine-tune aspects such as selecting the aggregation method, handling of missing values, or even the minimum number of lists a gene must appear in to be considered. This flexibility ensures the meta-analysis is aligned with your experimental design and data quality.
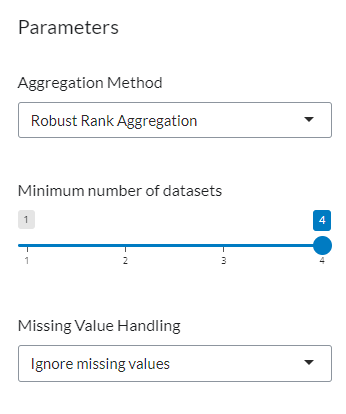
Figure 6: RobustRankAggreg Analysis Parameters. Configuration panel displaying the settings available to customize the aggregation method, missing value handling, and gene filtering criteria.
4.2.1 Aggregation Method
The RobustRankAggreg package offers five aggregation methods to combine rankings across multiple gene lists, ranging from simple statistical approaches to the more sophisticated probabilistic scoring native to the package:
- RRA: Uses a probabilistic model to assign p-values to ranks, based on the minimum probability across all lists. It evaluates how surprising a gene’s ranking is across the datasets using a beta-uniform mixture model.
- Median: Takes the median rank of each gene across all lists. It is robust to outliers and provides a central tendency measure.
- Stuart: A method based on order statistics. It combines ranks using a meta-analysis approach, particularly suitable for independent rankings.
- Geometric Mean: Computes the geometric mean of ranks across lists, giving more weight to consistently low ranks.
- Arithmetic Mean: Averages the rank values directly. This method is sensitive to outliers but intuitive and easy to interpret.
All of these methods rely on the position of genes in the individual rankings to compute a consensus order. The RRA method is unique in that it transforms rankings into p-values and evaluates their statistical significance, accounting for both the number of lists and the positions within each.
4.2.2 Minimum Number of Datasets
This slider sets the minimum fraction of input lists in which a gene must appear to be included in the analysis. Genes present in fewer lists will be excluded before the ranking process. For example: If you set it to 4 and there are 5 input lists, only genes appearing in at least 4 lists will be considered.
This filter helps reduce statistical noise caused by infrequent genes that may distort the consensus ranking. Genes that appear only once are always shown separately in the “Excluded genes” table, since they do not allow robust comparison and may bias the analysis if included.
4.2.3 NA Management
This option controls how to handle missing values (i.e., when a gene does not appear in a list). Two strategies are provided:
- Ignore NA: Exclude missing values from the analysis.
- Penalize NA: Assign worst rank for missing entries
In this context, additional penalization is not required beyond what the algorithm already incorporates. The score, also known as rho, is a significance measure used in RobustRankAggreg to reflect how strongly a gene is supported across the rankings. It is based on the minimum p-value method:
- Each gene’s position in a list is converted to a probability. For example, if a gene ranks 5th in a list of 1000, we calculate the probability of randomly selecting a gene ranked 5th or better.
- The lowest (best) of these probabilities across all lists is taken.
- The final score is calculated using a beta-uniform distribution, estimating the likelihood of observing such a good ranking by chance, given how many lists exist and in how many the gene appears.
If a gene is absent from some lists, the method does not assign an artificially bad rank. Instead, the score inherently adjusts for the fact that a gene appeared in fewer lists. This naturally penalizes low-frequency genes unless they show extremely strong evidence in the lists they do appear in. A low score means the gene’s strong ranks are unlikely to be due to chance and that it is consistently important across studies.
4.3 Outputs
4.3.1 Results Table (RRA)
The output table from the RobustRankAggreg (RRA) workflow differs slightly from the one used in RankProd. The available columns are:
| Column Name | Description |
|---|---|
| GeneID | Unique gene identifier, which can be a HUGO symbol (e.g., TP53), an Entrez ID (e.g., 7157), or an Ensembl ID (e.g., ENSG00000141510), depending on input. |
| Rank | Consensus ranking of the gene across all input lists; lower values indicate higher overall relevance or consistency among the lists. |
| Score | Also called rho, this is the probabilistic score assigned by RRA, reflecting the significance of the observed ranks (lower values indicate stronger evidence). |
| p.adjust | Adjusted p-value (multiple testing correction) for the Score using the Benjamini-Hochberg method; helps control the FDR. |
| FileCount | Number of input gene lists in which this gene appears; a higher count suggests greater consistency across datasets. |
| FileNames | Names of the input files where the gene was found, separated by spaces; useful for identifying the sources supporting the gene’s relevance. |
| GenePositions | Rank positions of the gene in each individual input list; provides insight into the gene’s performance across different datasets. |
Table 7: RobustRankAggreg Results Structure. Description of the gene identifiers, ranking metrics, and statistical scores provided in the RRA analysis output.
The table can be downloaded in .tsv and .csv formats. Each column has a tooltip (question mark icon) that shows information when hovered over. The table is interactive: columns can be filtered by intervals or keywords and reordered.
4.3.2 Excluded Genes
A secondary table is generated and accessible via the eye icon button, also downloadable as .tsv. It always contains genes excluded by the Minimum Number of Datasets filter and those appearing only once. If, for example, a filter of 4/4 is applied, genes appearing in 1, 2, or 3 lists are moved to this excluded table, while only genes appearing in all 4 lists remain in the main table. This table allows tracking of excluded genes and understanding of filtering effects.
| Column Name | Description |
|---|---|
| GeneID | Unique identifier of the excluded gene, in the same format as the input. |
| FileCount | Number of input gene lists in which this gene appears. |
| FileNames | Names of the input files where the gene was found. |
Table 8: RRA Excluded Genes Table. Description of the columns for genes that did not meet the minimum occurrence threshold defined in the filters.
5 Shared Elements
While each method, RankProd or RobustRankAggreg (RRA), has its own specific parameters and analysis pipeline, the app also includes a set of shared components that remain available regardless of the selected method. Among the shared functionalities, the app includes:
- A set of raw data visualizations (UpSet plot and interactive Heatmap) to examine overlaps and differences between gene lists.
- An enrichment analysis module based on the consensus genes obtained from the ranking process, with independent outputs.
- A visualization settings panel, allowing customization of the appearance of plots and tables (such as number of terms shown, font sizes, and colors).
These features provide robust tools for evaluating gene list consistency, biological relevance, and presentation quality of the results.
5.1 Shared Plots
Regardless of the selected method RankProd or RobustRankAggreg (RRA) the output always includes two additional visualizations: an UpSet plot and a Heatmap. These plots display the distribution of the raw input data, helping users to understand the relationships among the gene lists before any ranking or aggregation is performed. They allow checking for common genes across lists, unique genes in each list, and their proportions.
5.1.1 UpSet Plot
The UpSet plot visualizes intersections between the input gene lists. The top panel shows the size of each intersection (i.e., how many genes are shared between specific combinations of lists), while the left panel shows the size of each individual list. This plot is particularly useful when dealing with multiple sets where traditional Venn diagrams become difficult to interpret. The features of this plot are:
- The UpSet plot can be downloaded as
.pngor.jpg. - Users can customize the colors of both horizontal and vertical bars.
- Text size (including axis labels, titles, and legends) can also be adjusted.
- For more details, see Section 5.2 Data Visualization Tab.
Interpretation:
- Tall bars in the top panel indicate large overlaps between specific sets of gene lists.
- The connected dots below the bars specify which lists are involved in each intersection.
- This allows quick identification of genes common to many lists or unique to one or more specific lists.
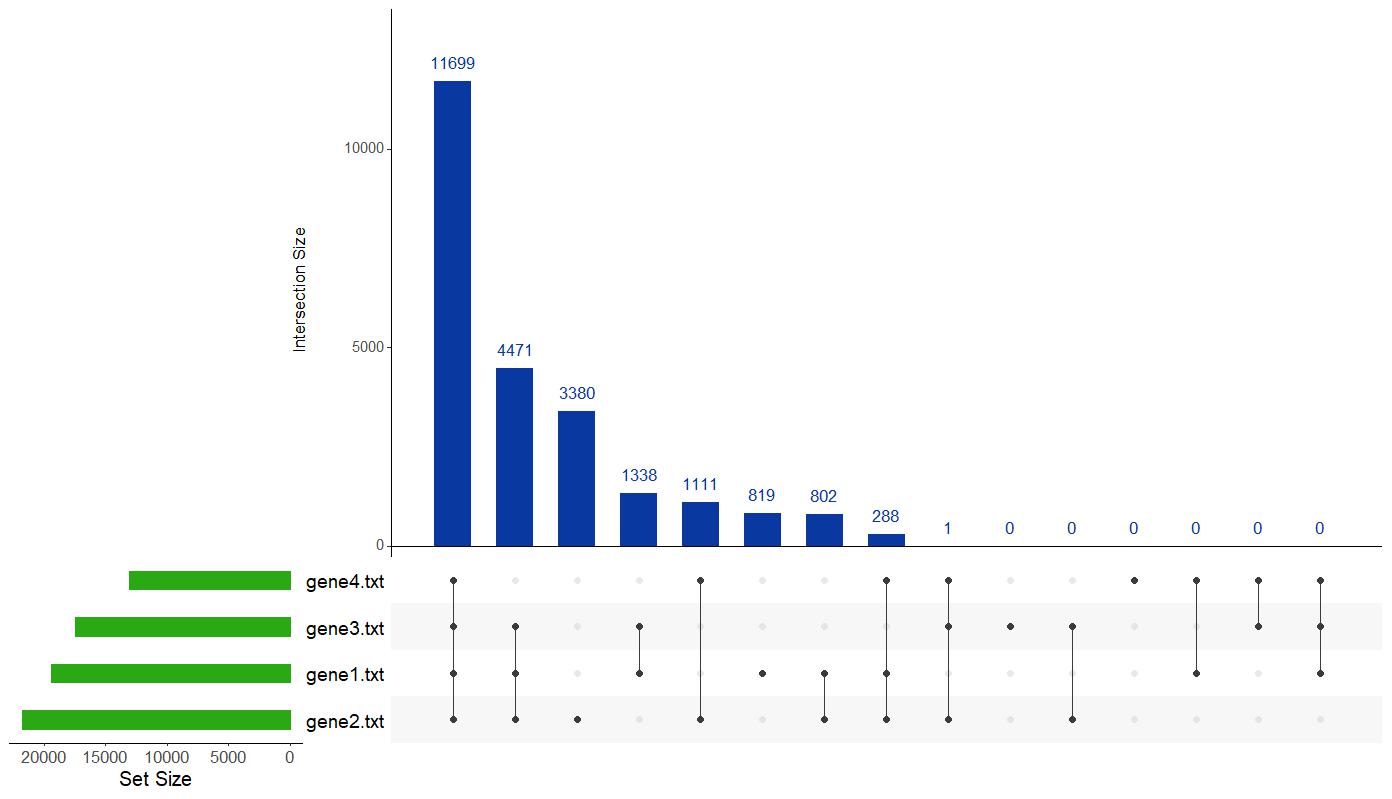
Figure 7: UpSet Plot of Gene List Intersections. Visual representation showing the overlaps and unique gene counts across the four example datasets included in the analysis.
5.1.2 Heatmap
The heatmap visualizes the pairwise similarity between all input gene lists. Each cell represents the proportion of shared genes between two lists, calculated as the ratio of common genes to the total number of genes in the corresponding reference list.
- The diagonal cells always show a value of 1.00, as each list is identical to itself.
- Off-diagonal cells indicate the degree of overlap between different lists (e.g., a value of 0.59 between List 1 and List 3 means that 59% of genes in List 1 are also present in List 3).
- The comparison is based on raw gene content, without considering rank or associated statistics.
Features:
- The heatmap can be downloaded in
.png,.jpg, or.htmlformats. - Users can adjust the title size, axis label size, and select among different color scales (e.g., Viridis, Cividis, Portland) to enhance readability and presentation (for more details, refer to section 5.2 Data Visualization Tab).
Interpretation:
- High similarity values indicate strong agreement in gene presence between lists.
- Lower values suggest variability or dataset-specific gene composition.
- This visualization helps identify outlier datasets or assess overall consistency among inputs.
Figure 8: Pairwise Similarity Heatmap. Interactive visualization displaying the proportion of shared genes between the four example datasets.
Note
This heatmap is fully interactive. Users can zoom in on specific regions, hover over individual cells to see detailed information (such as gene ID, list name, and rank/value), and explore patterns in greater detail. This interactivity enhances the ability to identify key trends and outliers within the data.
5.2 Shared Enrichment Analysis
Once the consensus ranking has been generated (whether by RankProd or RobustRankAggreg) MetaRank offers the option to perform Over-Representation Analysis (ORA) using the top-ranked genes. This analysis helps identify biological terms or pathways that are significantly associated with the consensus gene list, providing biological context and insight into the aggregated results.
All genes from the consensus list can be used for enrichment, providing a flexible way to explore functional relevance across different methods.
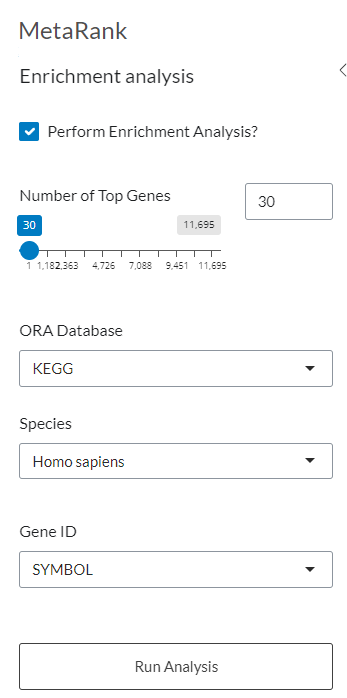
Figure 9: Enrichment Analysis Parameters. Configuration panel for performing Over-Representation Analysis (ORA) on the top-ranked genes from the consensus results.
5.2.1 Number of genes
This slider allows users to specify the number of pre-ranked genes considered in the enrichment analysis. The entire set of available genes can be explored, with the selection adjustable through the slider or by entering a precise numeric value in the designated field. For example, one may select exactly 4741 genes.
Tip
If the enrichment result shows no significant terms (e.g., the message “no biological information found” appears), consider increasing the number of genes selected. A larger input list increases the chance of capturing enriched pathways or categories.
5.2.2 Database
Gene Ontology (GO): A structured and controlled vocabulary used to describe the functions of genes and their products in a consistent and standardized way. Its content is divided into three sub-ontologies:
- Biological Process (BP): Pathways and larger processes (e.g., cell cycle, signal transduction).
- Molecular Function (MF): Biochemical activities (e.g., ATP binding, kinase activity).
- Cellular Component (CC): Subcellular locations (e.g., nucleus, ribosome).
KEGG (Kyoto Encyclopedia of Genes and Genomes): Database resource for understanding high-level functions and utilities of the biological system, such as the cell, the organism and the ecosystem, from molecular-level information, especially large-scale molecular datasets generated by genome sequencing and other high-throughput experimental technologies.
Reactome: A curated database of human biological pathways and reactions, including signaling, metabolism, and immune system processes. It also supports several model organisms via ortholog mapping.
Personalized: The system allows for the inclusion of customised annotations, provided that they comply with the structure defined in the information section. It is essential to maintain consistency between the nomenclature and the type of input data regarding the employees in the annotation, as automatic matching of identifiers and selection of the organisation is no longer performed.
All four resources serve as the reference background in the Over-Representation Analysis (ORA) step, where the frequency of your input genes in each term or pathway is statistically compared against a genomic background to identify the most significantly enriched biological categories.
5.2.3 Onology (GO only)
When Gene Ontology (GO) is selected as the database, an Ontology choice must be specified. Each GO branch provides a distinct view of gene function:
- Biological Process (BP) Describes high-level biological objectives accomplished by ordered assemblies of molecular functions—such as “cell cycle,” “signal transduction,” or “immune response.” Use BP to discover which overarching pathways or processes your genes collectively influence.
- Molecular Function (MF) Captures the elemental activities of proteins or gene products at the biochemical level—examples include “ATP binding,” “kinase activity,” or “transcription factor binding.” MF is ideal for pinpointing the specific enzymatic or binding roles enriched in your gene set.
- Cellular Component (CC) Defines where gene products exert their function within the cell, such as “nucleus,” “mitochondrion,” or “ribosome.” CC helps reveal the subcellular localization patterns common to your genes, indicating, for instance, whether they cluster in particular organelles.
Selecting the appropriate ontology refines the enrichment analysis, focusing it on either broader process-level insights (BP), detailed activity-level functions (MF), or spatial context within the cell (CC).
5.2.4 Personalized File Upload (Personalized database only)
This upload modal provides functionality for importing personalized annotation files. It is accompanied by an information button outlining the required structure and a download button that allows retrieval of the example file in .txt format.
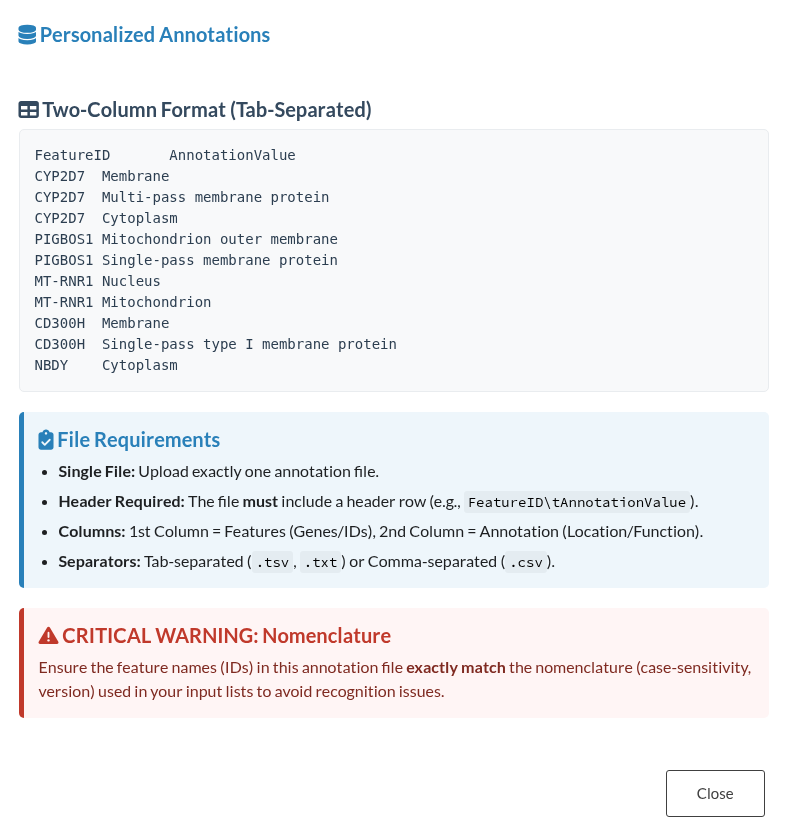
Figure 10: Custom Annotation File Structure. Information window displaying the required formatting guidelines and an example for uploading personalized annotation files.
The example below presents the personalized annotation file used in this case:
Table 9: Example Custom Annotation File. Content of the personalized dataset used to demonstrate the structure required for importing custom annotations.
5.2.5 Organism (Not available for Personalised)
The following organisms are supported, each identified by an internal code and NCBI Taxonomy ID:
- Homo sapiens (
Hsa; Taxonomy ID: 9606) – Human gene symbols follow the HGNC standard (e.g.,TP53). - Mus musculus (
Mmu; Taxonomy ID: 10090) – Mouse gene symbols use the MGI nomenclature (e.g.,Trp53). - Rattus norvegicus (
Rno; Taxonomy ID: 10116) – Rat gene symbols use RGD notation (e.g.,Rps6kb1).
5.2.6 GeneID (Not available for Personalised)
Specify the identifier system for your gene lists:
- SYMBOL: Common gene names or symbols (e.g.,
BRCA1). - ENTREZID: Unique numerical IDs assigned by NCBI (e.g.,
672). - ENSEMBL: Stable gene IDs from the Ensembl database (e.g.,
ENSG00000012048).
Warning
Ensuring consistency between the gene list format and the selected identifier type is critical. An incorrect choice of identifier system will result in erroneous mappings and inaccurate enrichment analyses. This constraint applies to all databases except Personalized, where the responsibility for maintaining compatibility rests with the user.
5.2.7 Outputs
5.2.7.1 Enrichment Table
The enrichment table displays the results of the Over-Representation Analysis (ORA) performed on the consensus gene list. It contains the following columns and can be downloaded as .csv or .tsv files for further use:
| Column | Description |
|---|---|
| ID | The unique identifier of the enrichment term. Examples include GO:0006915 for “apoptotic process” (Gene Ontology) or 05200 for “Pathways in cancer” (KEGG). |
| Description | A concise, human-readable name or description of the biological term or pathway, providing clear context. |
| GeneRatio | The ratio of input genes associated with the term over the total number of genes selected for enrichment (e.g., 5/100). |
| BgRatio | The ratio of all genes annotated with the term in the background/reference genome (e.g., 200/20000). |
| pvalue | Raw p-value from the enrichment test (e.g., Fisher’s exact test), representing the probability of observing the enrichment by chance. Lower values indicate stronger significance. |
| p.adjust | Adjusted p-value after multiple testing correction using the Benjamini–Hochberg False Discovery Rate (FDR) method. Lower values (< 0.05) suggest reliable significance. |
| GeneCount | Number of genes from the input list associated with the enrichment term. |
| GeneID | List of gene identifiers (e.g., SYMBOL, ENTREZID, or ENSEMBL) from the input that contributed to the enrichment, helping to identify specific genes driving the signal. |
Table 10: Enrichment Analysis Results. Description of the columns displaying term identifiers, statistical metrics, and gene associations derived from the Over-Representation Analysis.
In general, the table retains this structure. Nevertheless, when employing a personalized database where the annotated elements differ from genes, the columns GeneCount and GeneID are substituted by FeatureCount and FeatureID to ensure consistency with the nature of the annotated entities.
Tip
Each column in the results table includes a small question mark icon that provides additional information when hovered over. These tooltips offer concise explanations of the column’s purpose and how to interpret its values, allowing users to quickly understand the data without needing to refer back to the documentation. Simply place your cursor over the icon to view the tooltip — no need to click.
When using standard databases like ORA or KEGG, the enrichment results contain the columns GeneID and GeneCount, indicating the genes associated with the identified terms. Conversely, in analyses employing personalized annotations, where the annotated entities may represent various molecular types, these columns are replaced with FeatureID and FeatureCount to enhance interpretability and adaptability.
5.2.7.2 Enrichment Plot
The data resulting from the meta-analysis and summarized in the main results table is also represented visually through interactive plots. These plots provide a complementary overview of enriched terms and support intuitive interpretation of the results with this following features:
- Two plot type are available: Dot Plot and Bar Plot, both depicting the number of genes associated with each term (
gene count) and their corresponding adjusted p-values (p.adjust). The color scale can be customized to reflect statistical significance. - Tooltips appear on hover, displaying key information such as the full term or pathway
name,GeneCount, andadjusted p-value, enhancing interpretability. - Download Options include
.png,.jpg, or.html(interactive) formats, allowing users to export plots for presentations or further analysis.
Note
Table-Plot reactivity ensures consistency. For example, filtering the results table (e.g., by the word “cell”) dynamically updates the plot to show only the matching terms.
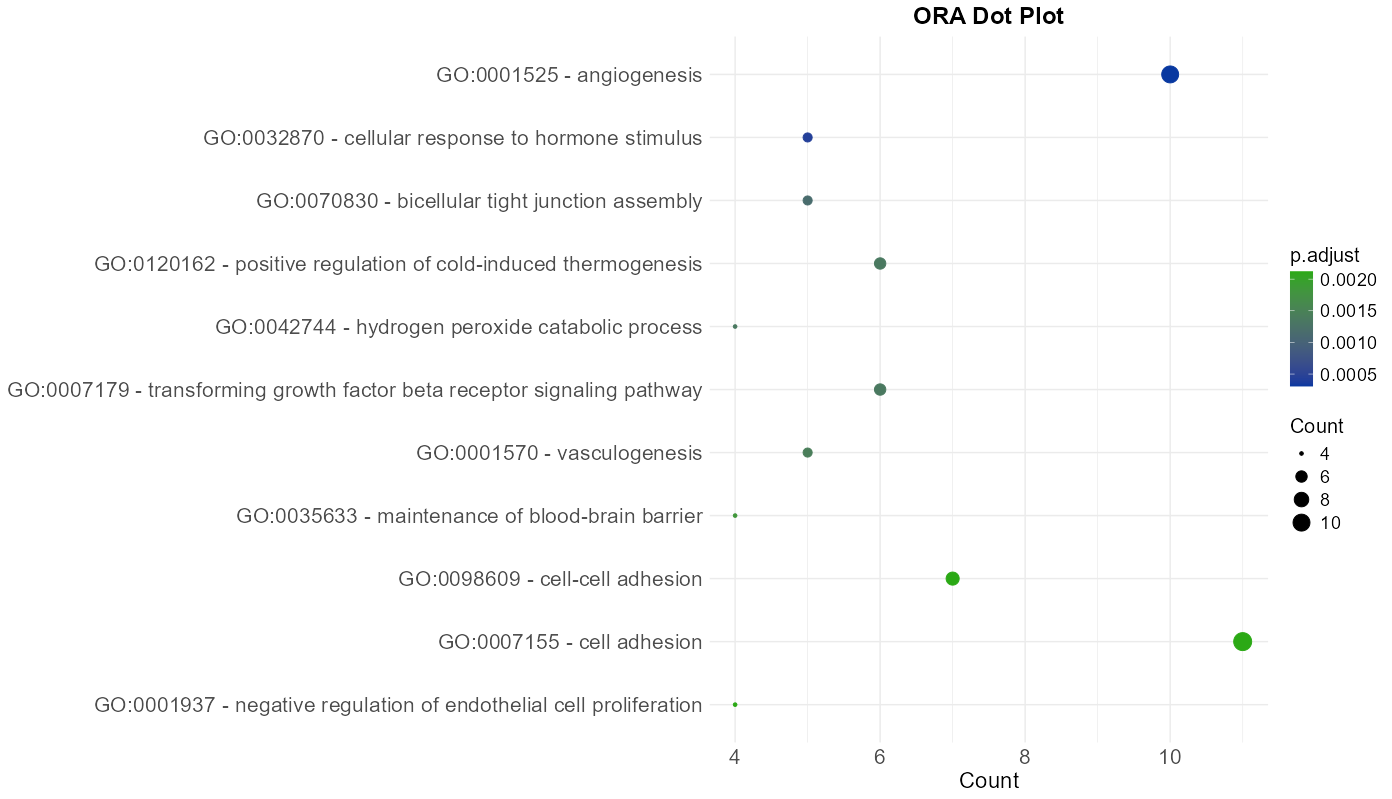
Figure 11: Enrichment Dot Plot. Visualization of significant terms where dot size corresponds to gene count and color indicates statistical significance.
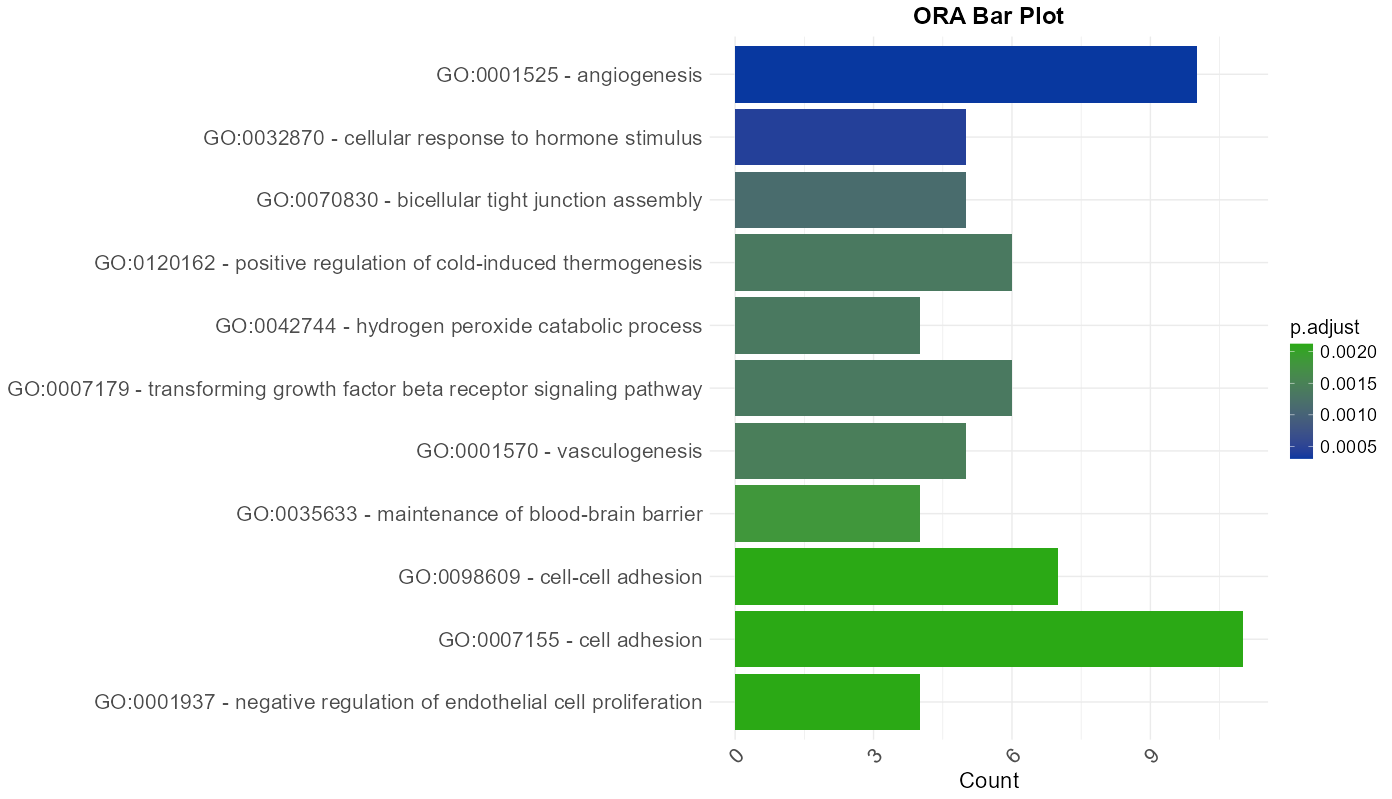
Figure 12: Enrichment Bar Plot. Graphical representation of top enriched terms showing the number of associated genes and their significance levels.
Figure 13: Interactive Enrichment Visualization. Dynamic plot allowing real-time data exploration, shown here with simplified Term ID labels for improved readability.
5.3 Data Visualization Tab
The “Data Visualization” tab, located in the sidebar panel, provides several customization options to tailor both the appearance and content of the output tables and plots. These settings are useful for enhancing presentation clarity, adjusting for accessibility needs, or focusing on specific aspects of the analysis.
5.3.1 Meta-analysis Table Settings
Users can toggle the visibility of specific columns in the consensus ranking table. The available columns differ depending on the selected meta-analysis method:
- RankProd includes columns like:
GeneID,Rank,FileCount,FileNames,GenePositions,RP_stat,PFP,pvalue, andp.adjust. - RRA includes:
GeneID,Rank,Score,p.adjust,FileCount,FileNames, andGenePositions.
Only selected columns are shown in the table and included in the downloaded file. This allows exporting customized summaries focused on the user’s needs.
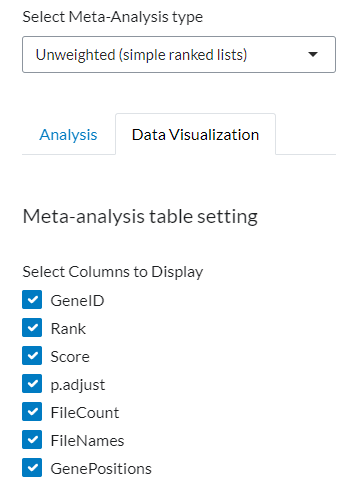
Figure 14: Results Table Configuration. Controls for toggling column visibility in the consensus ranking table, allowing customization of both the on-screen display and the exported file.
5.3.2 Upset plot
Customization options include:
- Text size: Affects axis labels, title, and legend. Recommended value: 27px.
- Color customization: Separate color selectors for vertical and horizontal bars. Default colors are green (
#2ba915) and blue (#0838a0), respectively.
These options help adapt the plot for presentations or specific visual preferences.
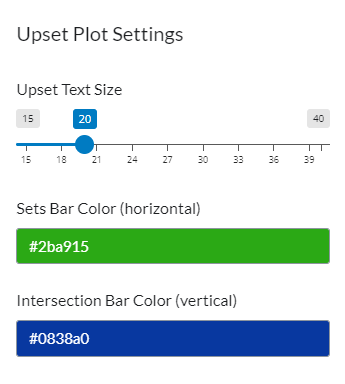
Figure 15: UpSet Plot Customization. Settings panel for adjusting text size and defining specific colors for the vertical and horizontal bars to enhance visual presentation.
5.3.3 Heatmap plot
This section provides options to:
- Adjust axis text size (recommended: 16px).
- Adjust title size (recommended: 20px).
- Select a color scale: Choose among Viridis, Cividis, or Portland palettes to match different visual or accessibility requirements.
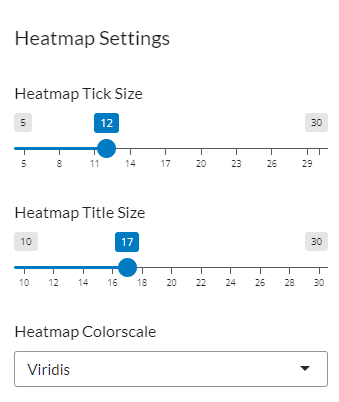
Figure 16: Heatmap Visualization Settings. Controls for modifying text sizes for axes and titles, and selecting the color palette used to represent similarity values.
5.3.4 Enrichment Table Settings
The interface allows selecting and deselecting specific columns from the enrichment result table. This customization enables users to tailor the displayed information to their needs. When using the download buttons, only the currently visible columns will be included in the exported file. For instance, if only the ID and Description columns are selected out of eight possible ones, the downloaded table will contain just those two.
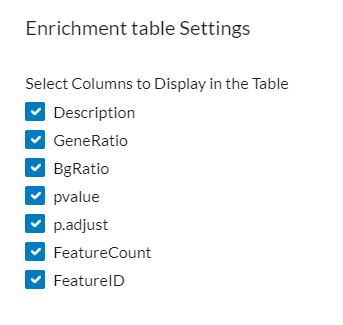
Figure 17: Enrichment Table Configuration. Interface for selecting active columns to customize the displayed information and the structure of the exported file.
Note
- Filters applied directly within the table interface (e.g., keyword searches such as “cell”) are reflected in the downloaded file too, but it works after running the analysis
- The table listing excluded genes or terms is not customizable—its structure and contents remain fixed for both display and export (full table).
5.3.5 Enrichment Plot Settings
This section allows customization of the appearance of enrichment plots to better suit presentation or analysis needs. Several visual parameters can be adjusted:
- Number of terms to show: Defines how many of the top-ranking enriched terms will be displayed in the plot. This helps focus the visualization on the most relevant results.
- Y-axis: Users can choose what appears on the Y-axis—either the
Term ID, theDescription, or a combination of both. When selecting both, the term and its description are shown together, separated by a hyphen (“-”), providing more context for each entry. - Plot Type: Two types of plots are supported:
- Dot plot, which represents each term as a point, usually with size or color indicating significance or gene count.
- Bar plot, where each term is displayed as a bar, useful for comparing absolute or relative values.
- Color Scale: A gradient color scale is applied based on the adjusted p-value (
p.adjust). Users can customize both ends of the color gradient (low and high values) to match their preferred visual style or color scheme. This makes interpretation easier, especially when using consistent color themes across multiple plots. - Text Size: Allows control over the font size used in the plot. Increasing or decreasing this value can help adapt the plot for screens, print, or accessibility preferences.
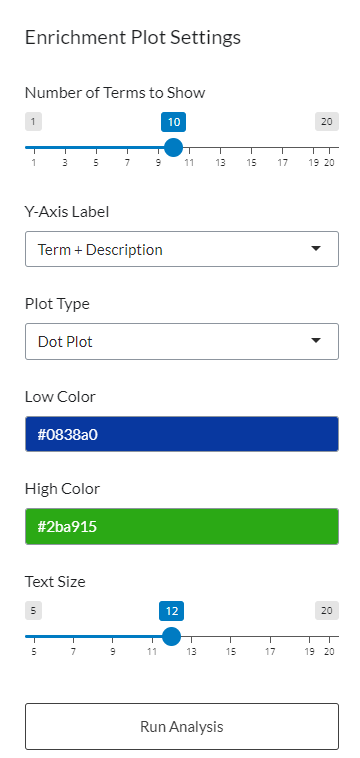
Figure 18: Enrichment Plot Settings. Configuration panel for adjusting visualization parameters, including plot type, term count, axis labels, color gradients, and font size.
6 Background Pipeline
MetaRank performs consensus-based gene ranking using two complementary strategies: RankProd (RP) and RobustRankAggreg (RRA). The workflow processes input gene lists through a rigorous pipeline of validation, filtration, and statistical aggregation to produce both tabular and graphical enrichment results.
6.1 Analysis Method Selection
The user initiates the workflow by selecting the meta-analysis strategy best suited to their data type:
- Weighted Analysis (RankProd):
- Designed for datasets where genes have associated numerical statistics (e.g.,
p-values,logFC, or expression levels). - Utilizes the Rank Product (RP) method to identify genes that are consistently highly ranked across experiments.
- Basic vs. Advanced: Users can choose between the standard implementation (RankProd basic) or the advanced mode (RankProd advance), which allows datasets to be grouped by metadata (e.g.,
origin,technology) using an “Origin” vector.
- Designed for datasets where genes have associated numerical statistics (e.g.,
- Unweighted Analysis (RRA):
- Designed for ranked lists where only the order of genes is available (no numerical scores).
- Utilizes the Robust Rank Aggregation (RRA) algorithm, which treats the gene ranks as order statistics.
- Supports multiple aggregation models, including the probabilistic
RRAmodel,Stuart’smethod, or simple statistics likeMean,Median, orMinimumrank.
6.2 Data Ingestion and Preprocessing
Users can provide gene data by uploading multiple files (.csv, .tsv, .txt) or pasting lists directly into a text box (supports multiline input). Additionally, it is possible to work exclusively with the example datasets provided by the app, which are also available for download.
The required input format depends on the selected analysis package:
- RankProd:
- Accepts
.csv(comma-separated) or.tsv(tab-separated) files. - Each file or list must contain two columns:
- One with gene identifiers (e.g.,
Gene,EntrezID, orEnsembl). - One numeric column representing a ranking metric (e.g.,
pvalue,logFC, etc.).
- One with gene identifiers (e.g.,
- Uploaded files or pasted text must NOT contain headers.
- In paste mode, multiple lists must be separated using the delimiter
###. - Make sure to check the info (ℹ) button for a detailed explanation of the correct input format.
- Accepts
- RRA:
- Accepts
.txtfiles or pasted plain text. - Each file or list must consist of a single column containing gene identifiers (e.g.,
Gene,EntrezID, orEnsembl), listed one per line in descending order of significance. - In paste mode, multiple lists must be separated using the delimiter
###. - Make sure to check the info (ℹ) button for a detailed explanation of the correct input format.
- Accepts
- Validation:
- The app validates uploaded content to ensure consistent formatting, presence of required columns, and proper delimiters.
- Automatic preprocessing includes:
- Removing blank rows.
- Trimming leading/trailing whitespace.
- Attempting to detect the gene identifier format (
SYMBOL,ENSEMBL, orENTREZID).
- If invalid input is detected, the app shows informative modals and provides example formats to guide the user.
6.3 Gene Appearance Counting and Filtering
For every gene across all input lists, the system:
- Counts the total number of appearances (i.e., in how many lists the gene is found),
- Records the names of the lists (or files) in which the gene appears,
- Stores the rank positions of the gene in each list where it is present. For example, if a gene appears at position 45 in list 1, position 98053 in list 2, and position 1 in list 3, the position vector would be:
45, 98053, 1.
This information is compiled into a detailed appearance table for each gene, enabling complete traceability and data auditing.
A user-defined minimum appearance threshold is applied:
- Genes must appear in a minimum number of input lists to be included in the final meta-analysis.
- This filtering step removes low-frequency or list-specific genes, which helps reduce background noise and increases the robustness of the consensus ranking.
- The threshold is configurable by the user to balance inclusiveness and specificity.
Outputs:
- Included genes: Genes that meet or exceed the appearance threshold. These are used in the meta-ranking process and included in the final results.
- Excluded genes: Genes that do not meet the threshold. These are completely excluded from both the consensus ranking and any enrichment analysis, which also helps reduce computational time. They are still accessible for review and optional download.
6.4 Consensus Ranking Computation
The selected meta-ranking method is applied to the filtered gene lists:
- RankProd:
- Computes rankings for upregulated and downregulated genes separately.
- Utilizes the
RPorRP.advancefunctions from theRankProdBioconductor package. - Includes advanced options such as:
- Handling of missing values (
NA) gracefully. - Custom directionality settings to rank by high or low values depending on the metric.
- Optional penalization of genes with low appearance frequency to further refine the consensus.
- Handling of missing values (
- RRA:
- Aggregates multiple ranked gene lists into a single consensus ranking.
- Uses the
aggregateRanksfunction from theRobustRankAggregpackage. - Performs a permutation-based statistical analysis to calculate:
- P-values, representing the likelihood of observing such high rankings by chance.
- Adjusted p-values, corrected for multiple testing using standard methods (Benjamini-Hochberg).
6.5 Final table creation
After computing the consensus ranking, a final result table is generated by merging the ranking outputs with the detailed gene appearance data.
- For included genes, the final table contains:
- Consensus ranking metrics (e.g.,
rank,p-value,scoredepending on method). - The number of appearances across all input lists.
- A list of input files in which the gene appears.
- A position vector, indicating the gene’s position in each list where it is present.
- This integration enables full traceability and biological interpretability of the ranking.
- Consensus ranking metrics (e.g.,
- For excluded genes, a separate table is created containing:
- The
GeneID, - The number of appearances,
- The names of the input files in which the gene was detected.
- This simplified table is made available for inspection and optional download, but these genes are not used in any part of the ranking or enrichment process.
- The
This two-table approach ensures a transparent analysis pipeline while maintaining performance and interpretability.
6.6 Annotation Retrieval (Optional)
- A dedicated script located at
database_annotations/get_annotations.Ris used to generate local annotation files for Gene Ontology (GO), KEGG, and Reactome. These files includeTERM2GENEandTERM2NAMEmappings required for enrichment analysis. - Instead of relying on online-access functions like
enrichGO()orenrichKEGG(), the system utilizes the more generalenricher()function from theclusterProfilerpackage. This approach:- Loads annotations into memory at runtime.
- Significantly improves performance.
- Prevents errors caused by lack of internet connectivity or remote service timeouts.
- All annotation files are stored in the
/database_annotations/directory and are automatically loaded by the app when enrichment is requested.
6.7 Over-Representation Analysis (Optional)
- Based on user settings, a subset of the top-ranked genes is selected from the consensus list.
- This selected gene set is then used to perform over-representation analysis against the locally loaded annotation databases.
- The enrichment analysis output includes:
- Term ID (e.g.,
GO:0008150,R-HSA-123456), - Description of the biological term or pathway,
- Raw p-values, and
- Associated gene sets involved in the enrichment.
- Term ID (e.g.,
6.8 Result Presentation
After the consensus analysis and optional enrichment, results are presented through multiple interactive and downloadable formats:
- Interactive Results Table:
- Displays the final list of ranked genes.
- Features include column visibility toggling, dynamic filtering, and downloadable formats (
.csvand.tsv).
- Excluded Gene Table:
- Displays genes filtered out due to low appearance frequency.
- Includes number of appearances and list of files in which each gene was found.
- Downloadable as
.tsvonly. - This table is optional and can be toggled on/off for inspection.
- Upset Plot:
- Visualizes intersections between input lists (i.e., which genes are shared across how many lists).
- Fully interactive with customization options.
- Downloadable as
.pngand.jpg.
- Heatmap:
- Shows the relative rank position of each gene across input lists.
- Provides customization options for clustering, color schemes, and font sizes.
- Downloadable as
.png,.jpg, and interactive.html.
- Enrichment Results Table (optional):
- Displays functional terms or biological pathways enriched among the selected genes.
- Includes term ID, description, p-values, and matching genes.
- Can be exported and explored alongside plots.
- Plotting Options for Gene Ranking:
- Choose between dot plot or bar plot representations.
- Customizable settings:
- Number of top-ranked genes to show.
- Color by p-value, rank, or appearance count.
- Axis labels (e.g.,
Gene Symbol,Rank,Score). - Text size and color scale.
- Download options include
.png,.jpg, and interactive.html.
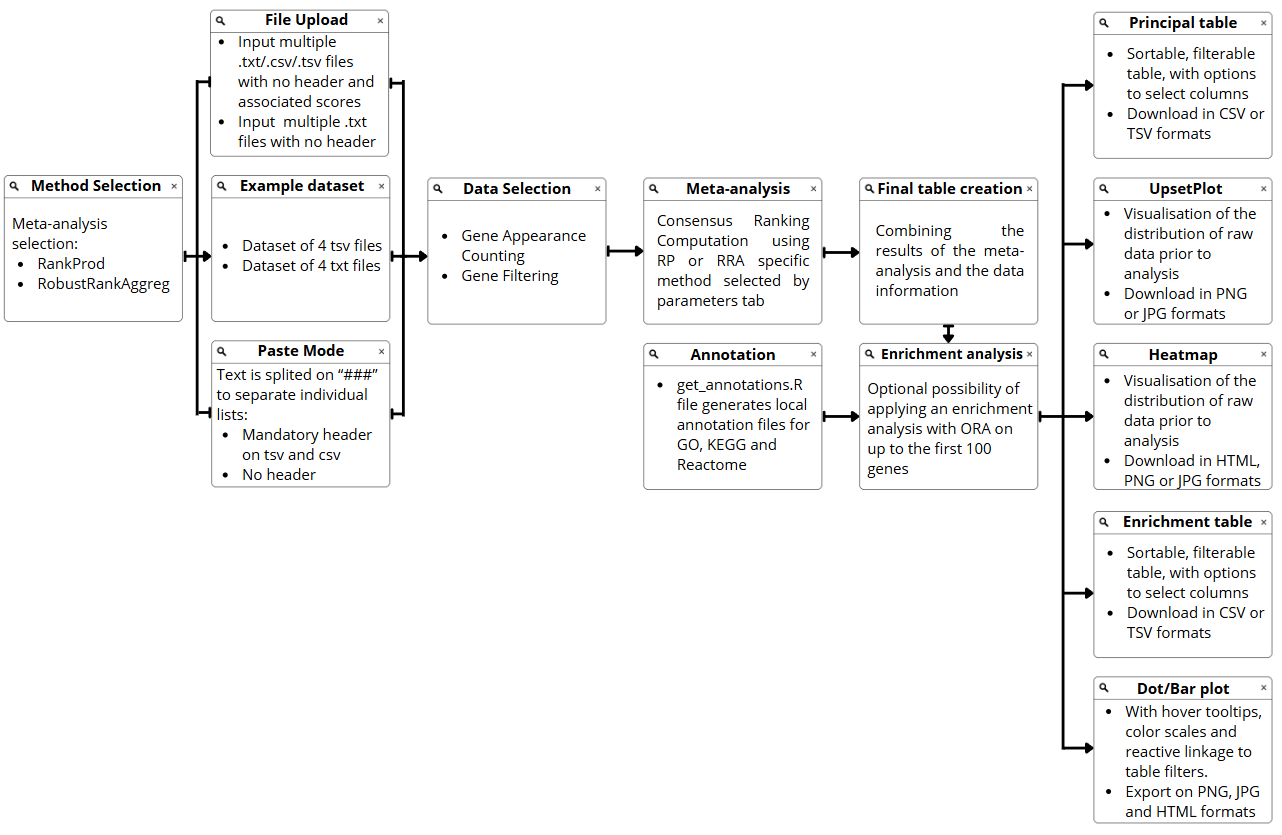
Figure 19: MetaRank Workflow. Comprehensive diagram illustrating the pipeline from data ingestion and method selection to consensus ranking, enrichment analysis, and final visualization.
7 Best Practices
To maximize the accuracy and reliability of your meta-analysis, we recommend adhering to the following guidelines:
Input Data Preparation
Respect Format Constraints:
- RankProd Files: Do not include headers. Ensure exactly two columns exist. Use standard decimal notation (dots preferred, though the app attempts to fix commas).
- Paste Mode: If pasting RankProd data, you must include headers (e.g.,
Gene,Pval) for the parser to recognize the columns correctly. - Separators: Use
###on a separate line to distinguish between lists when using the “Paste” method.
Gene Nomenclature:
- Use the official gene symbol or ID corresponding to your selected organism (e.g.,
TP53for Homo sapiens,Trp53for Mus musculus). - Avoid mixing ID types (e.g.,
SymbolsandEntrezIDs) within the same analysis, as this triggers validation errors or data loss.
- Use the official gene symbol or ID corresponding to your selected organism (e.g.,
Parameter Tuning
Handling Missing Values (RankProd):
- If your datasets are heterogeneous (different coverage), consider using “Impute NA” or “Penalize NA”.
- Use “Extra Penalization” if you want to strictly demote genes that do not appear in all lists, ensuring the top results are the most ubiquitous genes.
Optimizing the Appearance Filter:
- Strict (High Threshold): Use when you require high confidence and consensus (e.g., looking for core biomarkers).
- Relaxed (Low Threshold): Use when datasets are very diverse or have low overlap. Note that the app will auto-correct this value if it exceeds the maximum actual overlap.
Advanced RankProd (Origin):
- If combining replicates (e.g., 2 files from Lab A, 2 files from Lab B), use the “RankProd advance” method.
- Define the Origin vector carefully (e.g.,
1,1,2,2). Ensure the length matches the number of files and that no group has fewer than 2 replicates.
Enrichment Analysis
Custom Databases: When using the “Personalized” option, ensure your annotation file has exactly two columns (
FeatureID,Description) and includes a header row. Mismatched formats will block the analysis.Top Genes Selection: The enrichment test uses the top \(N\) genes from the consensus. Vary this number (e.g., 50 vs. 100) to see if pathway results are robust or driven by a few highly ranked genes..
Performance & Visualization
Large Datasets: For analyses involving >30 lists or thousands of enrichment terms, processing may slow down. Use the “Excluded Genes” table to verify if legitimate genes are being filtered out before they reach the computationally intensive steps.
Image Export: For publication, use
.pngor.jpg(high resolution). For data exploration, use.htmlto retain interactivity in Heatmaps and Dot plots.
8 Troubleshooting
The table below outlines common issues users may encounter during analysis, providing diagnostic insights and suggested solutions for resolution.
| Issue | Possible Solution |
|---|---|
| File Format Error (RRA) | Ensure input files are in .txt format containing a single column of gene identifiers (one per line) without headers. Avoid special characters like commas (,) or hashtags (#) within the gene names. |
| File Format Error (RankProd) | Ensure input files are in .txt, .tsv or .csv format containing exactly two columns (Gene ID and Statistic) separated by tabs or spaces, without headers. Verify that the second column contains numeric values only. |
| Paste Format Error (RRA) | Ensure each gene list is separated by a line containing only ### and that each gene appears on a new line. Do not include headers, tabular formatting, or hidden characters copied directly from spreadsheets. |
| Paste Format Error (RankProd) | Input must be structured with two columns per list (Gene ID and Statistic) separated by tabs or spaces, using ### to separate distinct lists. Ensure no headers are present and all statistics are valid numbers. |
| Invalid origin Field | Check for empty values, incorrect separators (must be tab or space), non-numeric values, or a mismatch between the number of files and the origin vector length. Also ensure sufficient replicates are defined for the analysis type. |
| Invalid Organism | Gene identifiers must match the capitalization rules of the selected species (e.g., TP53 for Human, Trp53 for Mouse). Use the dropdown menu to select the specific organism code that corresponds to your input data nomenclature. |
| Invalid Gene Identifiers | Verify that the selected ID type (SYMBOL, ENTREZID, ENSEMBL) strictly matches the format of the input genes to prevent data loss. Mixing ID types or using incorrect formats will result in validation errors or dropped genes. |
| No Enrichment Results | If the analysis returns empty tables, the filtering criteria may be too strict or the gene list may lack annotation coverage in the selected database. Try lowering the “Minimum Number of Lists” threshold to include more terms. |
| Appearance Threshold Too High | This error occurs when the “Minimum Number of Lists” filter is set higher than the maximum observed overlap between datasets. Reduce the threshold value to include genes present in fewer datasets. |
| No Repeated Genes Across Lists | The analysis requires shared elements across lists to establish a consensus ranking. If lists are completely disjointed (zero overlap), check the input data for comparability or consistent naming conventions. |
| Slow Performance | Processing times increase significantly with high complexity (e.g., >30 lists or >1000 significant terms). To optimize, reduce the number of lists, increase the minimum dataset threshold, or simplify visualization parameters. |
| Absent Annotation File | The “Personalized” database option was selected, but no corresponding annotation file was uploaded. Provide a valid file to proceed with the enrichment analysis. |
| Invalid Annotation File Format | Custom annotation files must contain exactly two columns (Feature ID and Description) in .csv, .tsv, or .txt format. Ensure the correct separator is used and the structure is consistent throughout the file. |
Table 11: Troubleshooting Guide. Summary of common errors, potential causes, and suggested solutions.
In addition to the summary provided above, the following section visually illustrates the primary error messages generated by the application. Each figure corresponds to a specific input or processing validation event, offering a brief explanation of the trigger, its impact on the workflow, and the necessary corrective actions. Where applicable, specific file constraints or missing parameters are highlighted to assist in rapid resolution.
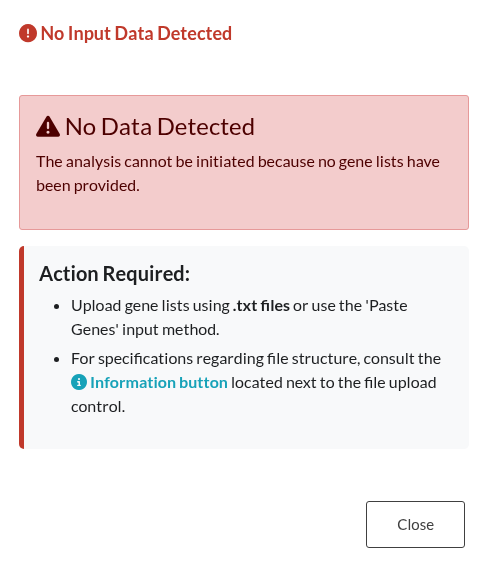
Figure 20: Input Existence Check. Notification displayed when an analysis is triggered without providing any gene lists.
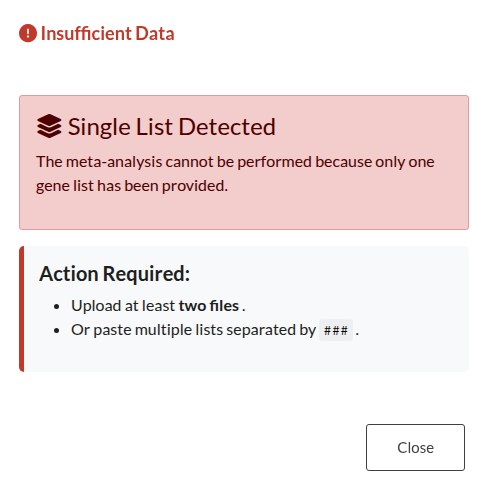
Figure 21: Insufficient Input Data. Alert triggered when fewer than two lists are uploaded. Meta-analysis requires at least two valid gene lists.
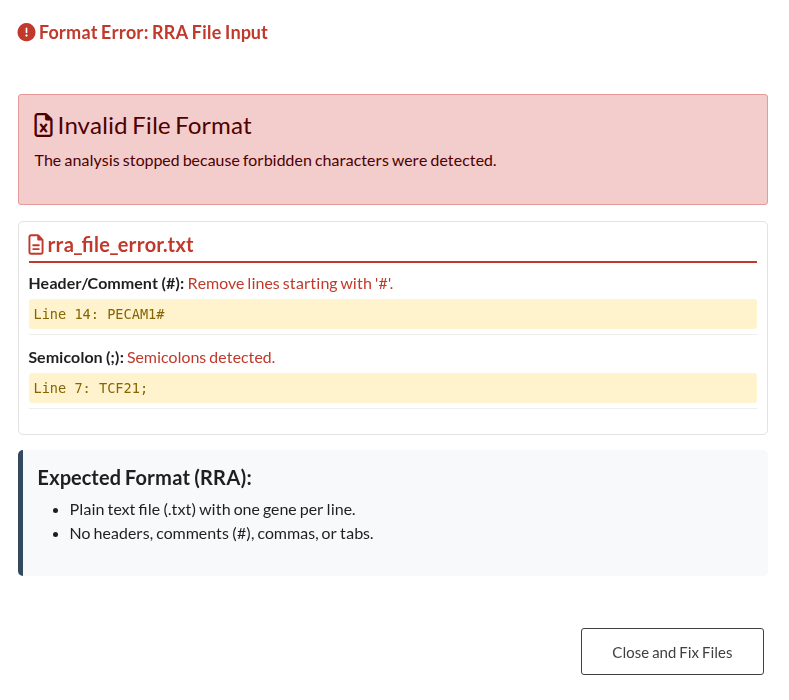
Figure 22: RRA File Format Error. Notification indicating the presence of forbidden characters, such as headers or commas, within the RRA input file.
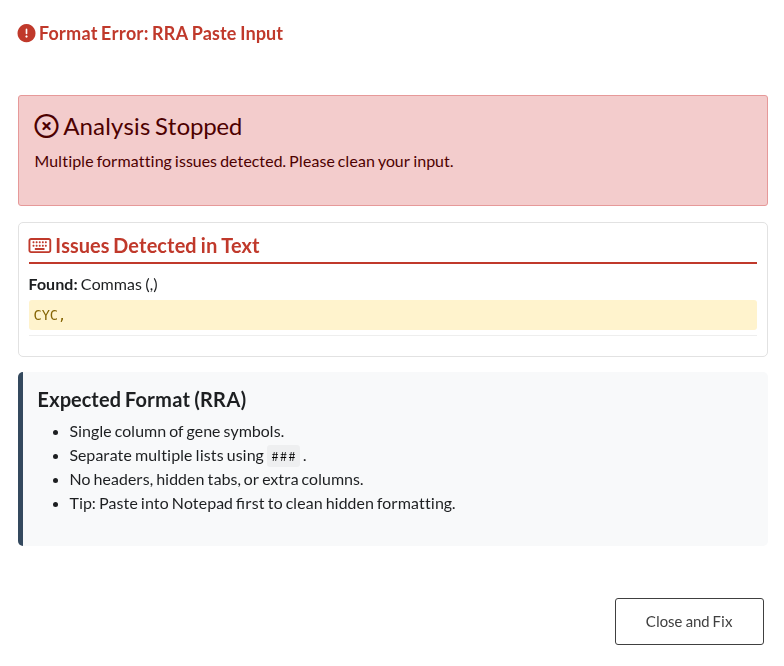
Figure 23: RRA Paste Format Error. Warning displayed when pasted RRA data contains structural errors, such as included headers or incorrect alignment.
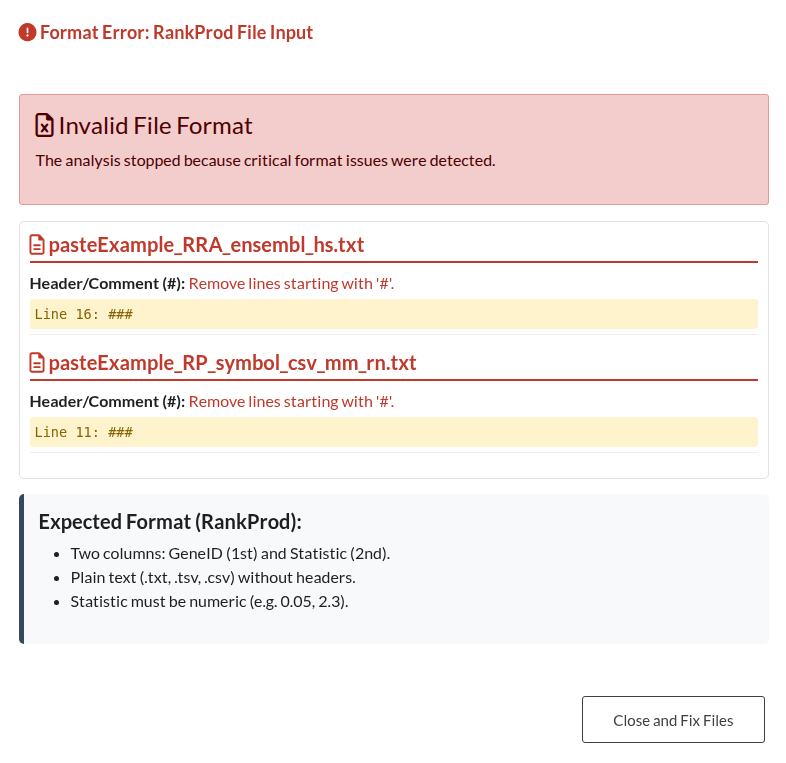
Figure 24: RankProd File Structure Error. Notification triggered when a RankProd input file deviates from the required two-column format (Gene ID and Statistic).
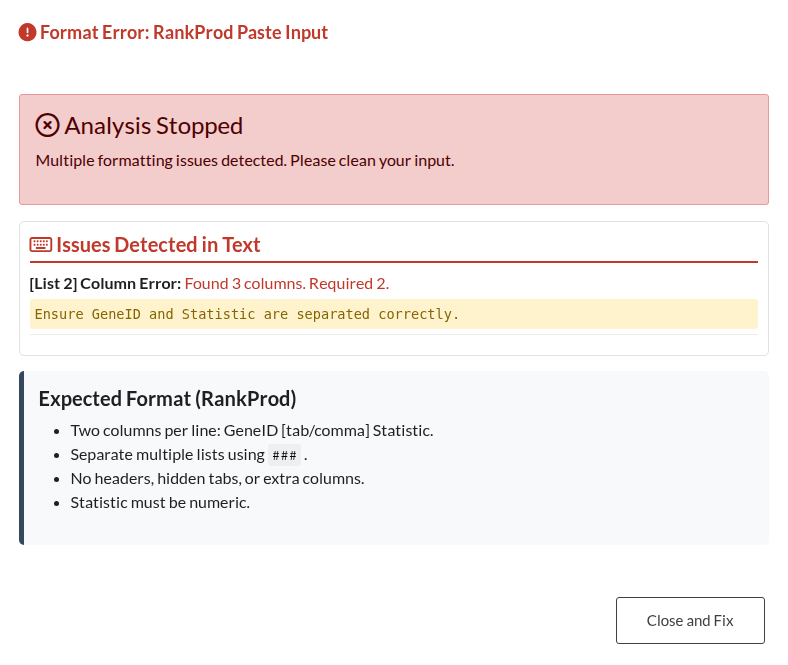
Figure 25: RankProd Data Integrity Warning. Alert indicating incomplete rows or missing values within the pasted RankProd data.
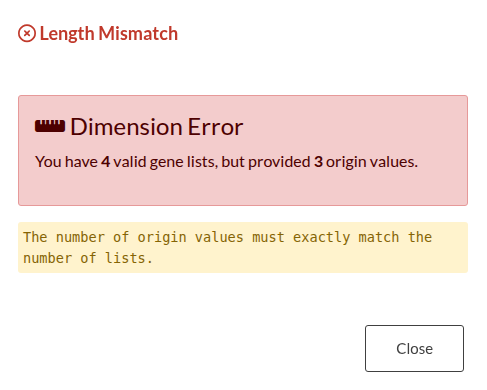
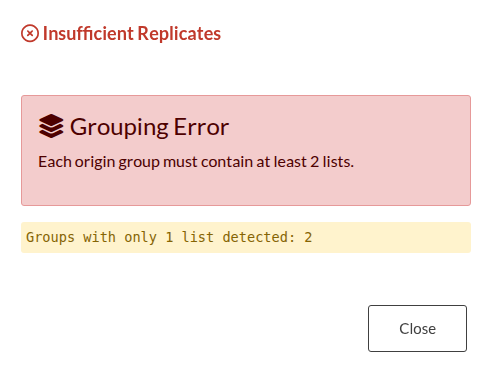
Figure 26: Origin Vector Validation Errors. (a) Error triggered by a mismatch between the number of input files and the origin vector length. (b) Error triggered when there are insufficient replicates within a specific group.
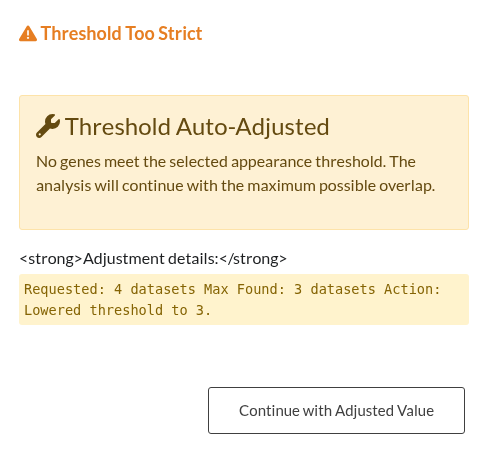
Figure 27: Strict Threshold Error. Notification displayed when the “Minimum Number of Datasets” filter exceeds the actual gene overlap observed across lists.
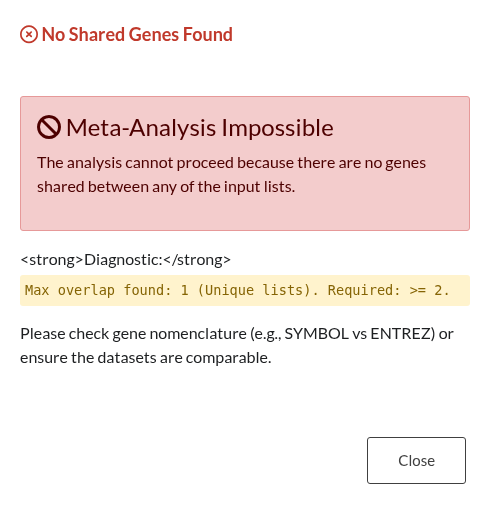
Figure 28: Zero Overlap Error. Alert indicating that no shared genes were identified between the provided input lists.
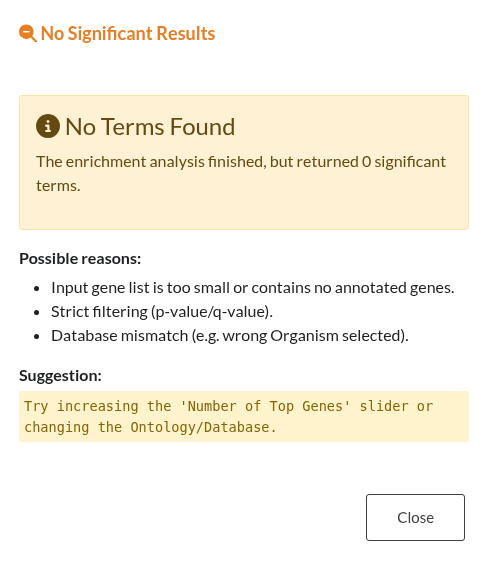
Figure 29: Null Enrichment Results. Notification displayed when the analysis completes successfully but yields no statistically significant terms.
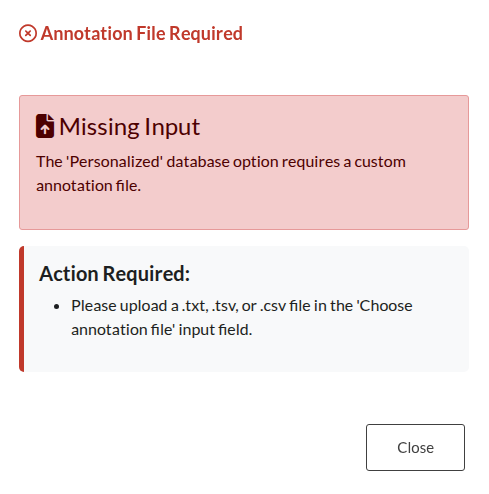
Figure 30: Missing Annotation File. Error triggered when the “Personalized” database option is selected without uploading a corresponding annotation file.
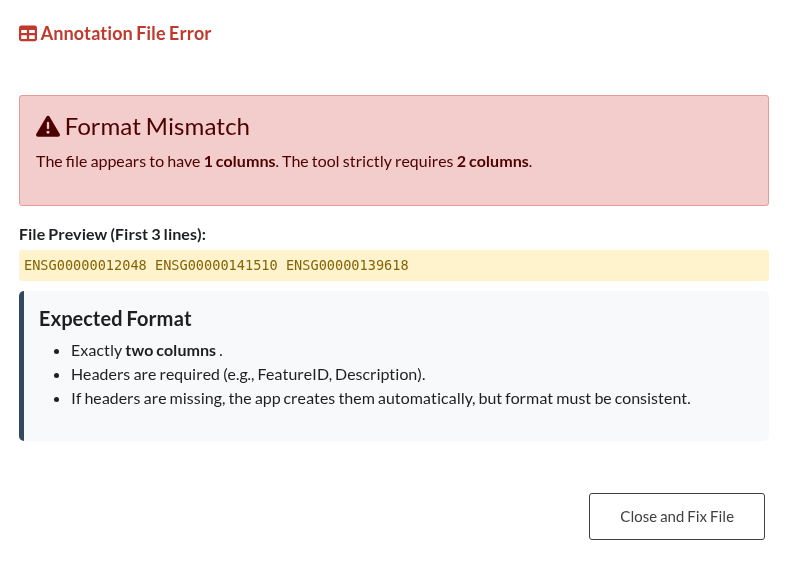
Figure 31: Annotation Format Error. Notification indicating that the custom annotation file fails to adhere to the required two-column structure.
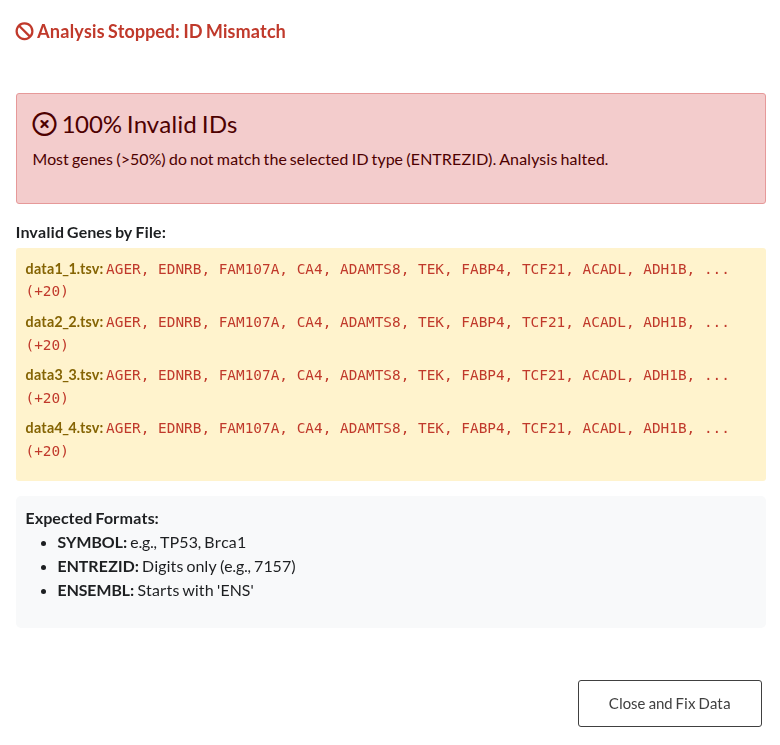
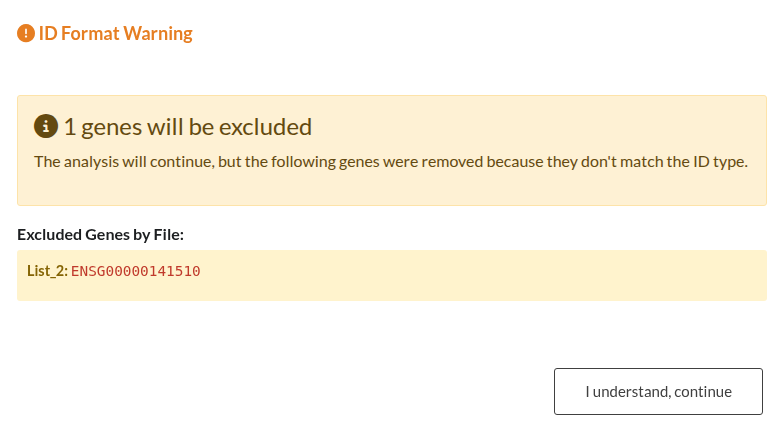
Figure 32: Gene ID Validation Outcomes. (a) Blocking Error: Analysis is halted due to a high error rate (>50%) in Gene IDs (e.g., mismatch between selected ID type and input). (b) Non-Blocking Warning: Alert indicating a minority (<50%) of invalid IDs; analysis may proceed with valid genes.
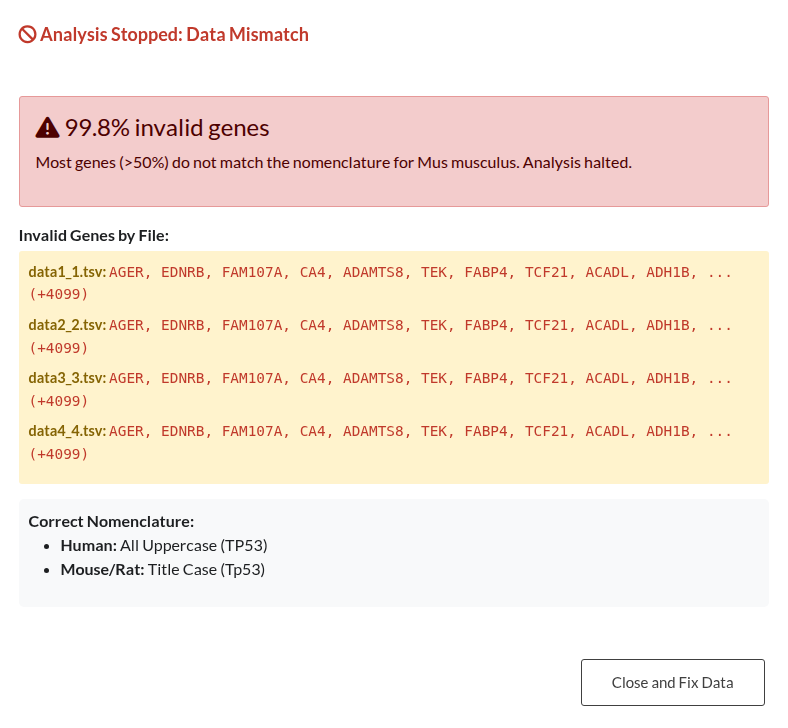
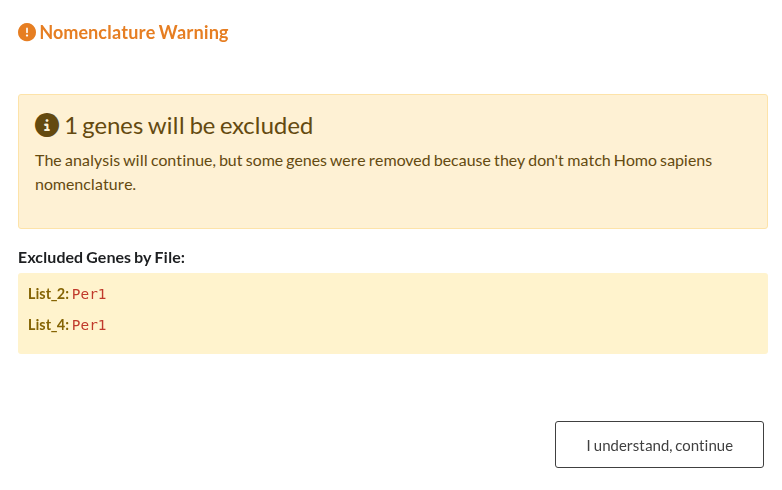
Figure 33: Organism Nomenclature Validation Outcomes. (a) Blocking Error: Analysis is halted when >50% of gene symbols do not match the expected capitalization for the selected organism. (b) Non-Blocking Warning: Alert indicating a minority (<50%) of mismatched symbols; analysis may proceed with valid genes.